


Share This

An Emphatic Structural Break in the US Bond Market
Sep 28, 2026
• Clear evidence of a possible/probable new regime in the US bond market
• Equities can ignore only as long as earnings forecasts continue to rise
• Credit markets more nervous particularly with heavy supply from tech sector
• For defensive equities look to the utility sector after some marked underperformance
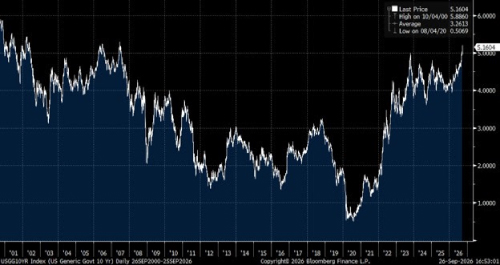
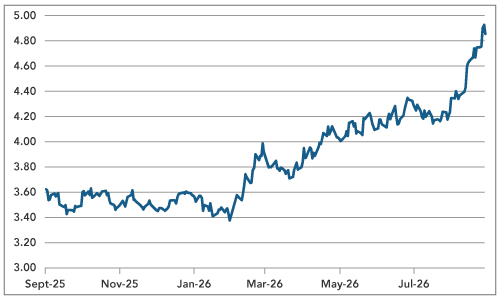
The US bond market may have provided the clearest evidence yet that we are in a different interest rate regime. The benchmark 10-year Treasury yield closed at around 5.16%, its highest level since 2007 and some 13 basis points above June’s peak of 5.29%. The speed of the latest move has been impressive. Bond volatility is up almost 30% in just five days; if we only look at that then we’ll miss the much bigger point — it isn’t volatility but absolute level of yields that matters now.
Chart 1: Highest 10-year Yield in Sometime
Source: Bloomberg
Look at the chart. For most of the period after the Global Financial Crisis 4% on the 10-year Treasury looked high. After the pandemic it briefly looked almost unthinkable. It was just 0.51% in August 2020 — six years later it’s 5.16% (yield on world’s benchmark “risk free” asset) an extraordinary increase of roughly 465 basis points. Nor is 5% just another number on the chart. The average 10-year yield over the period shown here is only around 3.0%. Today’s yield is therefore more than 200 basis points above the average of the last two decades; more importantly, it takes us back into territory investors haven’t seen.
Chart 2: MOVE Index of US Bond Volatility rises 30%
Source: Bloomberg
We spent most of the last fifteen years talking about whether interest rates would “normalise”. They now have. Maybe they normalised to somewhere very different from the world markets became used to between 2009 and 2021. The era when capital was essentially free, duration was rewarded all the time and almost every asset could be valued against a 1–3% government bond yield is over — at least for now.
Higher yields change everything. They increase the discount rate used to value future corporate earnings; mortgage and refinancing costs rise; leveraged business models are challenged; private-market valuations change; investors get something they’d mostly forgotten about: a return from holding the risk-free asset itself. A Treasury yielding more than 5% gives you quite a different hurdle rate for equities, private equity, property and credit than a Treasury yielding 1%. And yet there is a fascinating contradiction between asset classes. Even while the Treasury market has been going through this enormous repricing, the Nasdaq 100 has been trading around record highs. Equities (particularly technology equities) look remarkably relaxed about something that historically should matter enormously to their valuation.
The divergence between US equities and credit market is a challenging development for strategists. Bonds are saying the cost of capital has changed dramatically. Equities are saying earnings growth (particularly the growth associated with AI and technology) can overcome that higher discount rate.
Both arguments can hold for a while. Strong nominal growth can support corporate earnings even as bond yields rise. Productivity gains could also justify higher equity valuations even with a higher cost of capital. But there’s an uncomfortable historical lesson here: large divergences between the message from the bond market and that from the equity market don’t last forever.
The bond market isn’t just going through another bout of volatility. It is potentially telling us something much more important. The price of money has changed. Markets are still working out what everything else should be worth as a consequence.
The standard read on last week’s bond move is hawkish but not necessarily worrying. Red-hot industrial surveys (flash composite print hit the highest level in four years) and the Atlanta Fed GDPNow model signalling an almost 5% GDP growth reflect economic strength rather than weakness and have given some room for central banks to openly talk about more rate hikes. In fact, regional Fed presidents’ speeches last week leaned towards hawkish (Goolsbee, Barkin, Musalem, Williams, Barr, Hammack), with several explicitly citing an economy that was firming up and not slowing down. From the Fed to the ECB, nobody in this cycle is currently pricing in the need for a growth sacrifice to get inflation back to target.
Complacency is the risk. Central bankers entered this tightening cycle expecting a handful of modest, post-2022-style rate moves to finish the job — the light-touch playbook that has defined policy from the financial crisis through COVID and out the other side. That playbook isn’t working anymore. What’s showing up in the data looks less like a residual inflation problem to be mopped up and more like a structural one — AI-driven capex demand, tight labour markets, sustained fiscal deficits, and now a fresh energy shock from the Iran war, all pushing in the same direction at once. If that diagnosis is right, central banks may end up needing rate levels this cycle hasn’t seen in decades, not the incremental quarter-point moves that have defined policy since 2008. It feels less like 2022’s inflation scare and more like an echo of the 1980s — when getting inflation out of the system took real, sustained pain rather than a light touch on the brake.
Something has changed here, though perhaps not where you’d expect it. A hot economy raising the return on capital, and inflation expectations with it, should push long yields higher — that’s textbook logic, not an anomaly. What’s more notable is where the move is concentrated: it’s the forward terminal-rate proxy — the market’s read on the neutral interest rate three years out — that’s moved the most, roughly 50bps in a single month. That’s a repricing of the medium-run structural interest rate, not just the near-term policy path, and those estimates don’t usually move that fast. If the broader asset markets were taking that repricing at face value, you’d expect it to show up as a headwind for long-duration equities such as technology — instead, the Nasdaq hit a record the same week. That gap between what the bond market and the equity market are each pricing is the thing worth watching, more than the direction of the move itself.
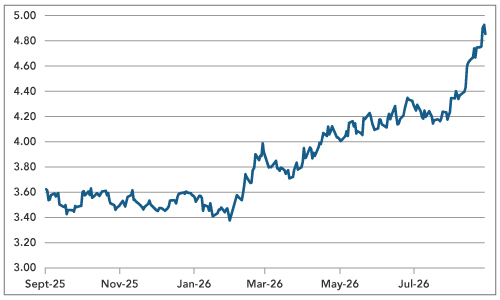
Chart 3: Remarkable Reversal in the Yen’s Previous Weakness against the Dollar
Source: Bloomberg
A second, driver of bond yields needs equal billing: supply. AI-linked companies have issued more than $500 billion in debt so far this year (40% from hyperscalers alone); next year, gross issuance from hyperscalers is projected to hit $420bn (+60%), but overall US corporate issuance this year is already 30% ahead of last year at $1.9 trillion. Bottom line: lots of bond paper competing for the same pool of capital that would otherwise be absorbing Treasury supply.
Higher neutral rates domestically, combined with the prospect of AI-related debt crowding out demand for Treasuries, are putting upward pressure on yields at both the long and short end of the curve. Ongoing government overspending in the US only adds to the strain on bond markets.
The fiscal challenge is global, not just American. Developed-economy governments paid over $3.3 trillion in interest on debt last year, more than the world spent on AI, defense, and clean energy put together. France’s public debt is forecast to hit a record 119.3% of GDP this year, pushing OAT-Bund spreads wider ahead of its own election cycle. The UK, Japan, and the US are all seeing long yields push higher together. This isn’t a US story about one Fed decision — it’s a repricing of what governments have to pay to borrow everywhere, at the same time the largest-ever private capex cycle in the world is also trying to raise money in the same market.
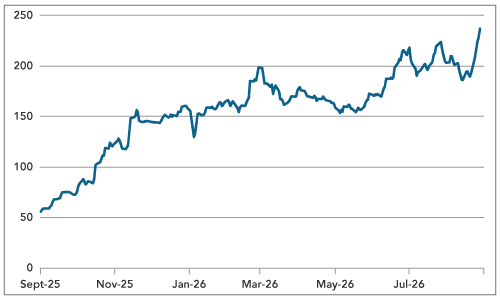
Equities were quiet all week, but credit cracked at the edges: Oracle’s 10-year yield rose 37bps to 7.34% (issued in February at 5.73%), and its CDS hit a record 237bps — wider than the peak of the 2008 crisis — after reports emerged that Oracle was trying to invoke force majeure on a data-center lease tied to its Stargate buildout. Meta, Amazon, and Microsoft credit all widened materially over the past month even as equities hit fresh highs. High-yield spreads are the widest since early April. None of this is systemic yet — Big Tech balance sheets remain enormous cash generators, and hyperscaler credit worries look more like a “how much” and “how fast” question than a solvency one — but the direction of travel (credit spreads leading, equities lagging) is exactly the sequence worth watching, because it’s usually credit that tells you first when a financing boom has outrun its cash flows.
Chart 4: Oracle 5-year CDS (Bps)
Source: Bloomberg
Growth is strong but concentrated right now, and the beneficiaries are a very small slice of the population. The strength is real and broad-based on paper: composite activity data firmed across the US, Europe, and Japan this month, and hard capex numbers back it up – core capital goods orders were up 14% year-on-year, machinery orders advanced 15%, and computer and electronic equipment orders surged 16.5% — the fingerprints of a genuine, economy-wide data-center buildout, not just inflated equity multiples. But the gains from that boom are landing overwhelmingly with asset owners. The 30-name AI basket made up 38% of S&P 500 market cap at the start of the year but drove 56% of the index’s second-quarter gain, and wealth gains for the top 1% over the past year ran more than 30 times those of the bottom half. That concentration is propping up consumption — the falling savings rate is mostly a wealth effect from equity gains that sit with a small cohort — while persistently high price levels keep weighing on how everyone else describes their situation even as they keep spending. That’s the split defining this cycle: a genuinely strong economy whose rewards are not being broadly shared.
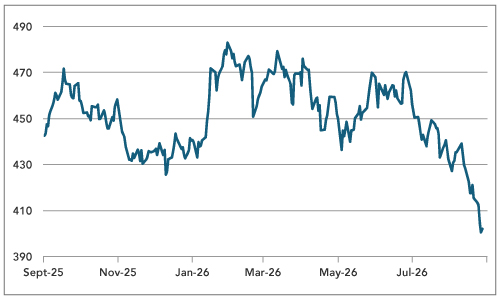
The utilities sector is a nice, real-time example of “AI boom” and “narrow pain” coexisting in the same trade. The XLU ETF is down nearly 20% from its peak earlier this year, with its Relative Strength Index hovering near a three-year low in oversold territory—yet power demand from data centers remains one of the more durable structural tailwinds the sector has had in decades. The read-through isn’t that the market has soured on AI-driven electricity demand; it’s that utilities are long-duration bond proxies, and a historic bond sell-off hits them regardless of their underlying fundamental story.
Chart 5: S&P500 Utilities Sector Index
Source: Bloomberg
One key event risk that markets may not yet have substantially priced in is the midterms themselves. Political rhetoric will almost certainly reach a fever pitch in the final days leading to the vote. The White House is on the back foot on several fronts—diesel prices, utility bills, tariff fallout—and an administration under that kind of pressure has every incentive to manage the optics ahead of such a crucial vote.
The clearest lever is Iran: Trump has already floated a deal landing conveniently after the vote, which reads as much as a political timeline as a diplomatic one. Legal and procedural manoeuvring around the vote itself is a more plausible source of volatility than anything more extreme; chatter about “extraordinary measures” circulates in every high-stakes cycle, but assigning it real weight gets well ahead of the evidence. The more grounded read is a White House trying to control the news cycle through conventional, if aggressive, means—a source of tail volatility worth having on the radar ahead of November that isn’t obviously reflected in current pricing.
What to watch this week: Wednesday’s September core PCE print (consensus 3.7%) will be the key test yet of whether inflation is even beginning to soften under a hawkish Fed, alongside a cluster of Fed speakers (Barkin, Cook, Goolsbee, Kashkari) who’ll be parsed for any shift in tone after last week’s uniformly hawkish chorus. Friday’s September jobs report (consensus around 100K, down from August’s 162K) will be the other key test — a second soft-but-positive print will keep the soft-landing-with-higher-rates narrative alive, while a surprise in either direction could move the terminal-rate conversation quickly. Beyond the data, worth tracking will be: whether Oracle- and hyperscaler-specific credit stress broadens beyond a handful of names, and any further signals from Treasury’s long-end buyback programme as it tries to manage the back end of the curve.