
Jun 8, 2026
Markets spent most of the last week patting themselves on the back. Then, on Friday, US chipmaker and infrastructure software group Broadcom Inc reported earnings, and the mood shifted rather abruptly. What followed was less a market correction and more a reminder that when valuations are priced for perfection, you do not need bad news to trigger a sell-off. You only need news that is slightly less rapturous than hoped.
Broadcom’s quarterly revenue came in at $22.2 billion against consensus expectations of $22.3 billion. The shortfall was $90 million, or roughly 0.4%, and the stock plunged 12.6%. Although the underperformance was significant, we cannot attribute it to a market repricing a business. Rather, it signifies the market discovering, in real time, that investor positioning had become the dominant variable. The tech-heavy Nasdaq fell 4.7% on the week. The broader S&P 500 retreated from a record above 7,600 to close at 7,383 and, for now, remains above its 50-day moving average of approximately 7,150, but only just.
Chart 1: Broadcom an Exaggerated Version of Tech Sector Tear-to-Date

Source: Bloomberg
Chart 2: S&P 500 a Distance from Supportive Moving Averages
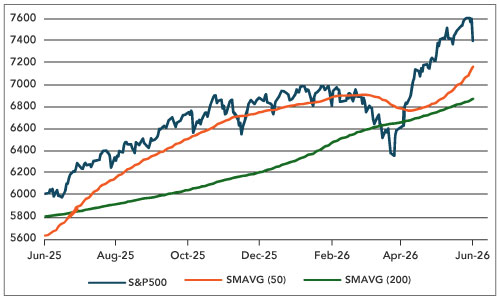
Source: Bloomberg
Retail Investors Have Gone All In — With Borrowed Money – into leveraged ETFs
As is often the case, retail investors have been caught out. In the days immediately before the current reversal began, retail investors poured a record single-day amount into the largest US software ETF. US equity funds received $7.43 billion in the week to 3 June, with US technology funds alone absorbing almost $6.60 billion; global technology funds attracted inflows of a further $9.02 billion. These flows landed at almost the precise moment the sector peaked.
This is not a coincidence — it is the natural arc of a late-cycle trade. Retail investors, understandably attracted by year-to-date performance, arrive just as the marginal institutional buyer is looking for the exit. Leverage compounds the problem. FINRA data show US margin debt rising 6.8% in April alone to a nominal record, with total margin borrowing approaching $1.2 trillion alongside approximately $250 billion in leveraged exchange-traded products. Margin debt at record levels is, in isolation, not alarming, because it tends to peak when markets do. The danger is the mechanism it creates on the way down: falling prices trigger collateral calls, which force further selling, which triggers more collateral calls. An orderly correction becomes something faster and less pleasant.
The S&P 500’s technology weighting had risen above 39%, implying that the index is effectively a leveraged bet on a handful of companies whose valuations rest on expectations of a future that has not yet arrived. The internal picture is already weakening. Friday’s decline came on elevated volume, with decliners substantially outnumbering advancers. If the index cannot recover above 7,500 with improving breadth, a break of 7,150 would open the way toward 7,000 and, beyond that, the 200-day average near 6,850.
SpaceX and the Equity Issuance Signal
Enter SpaceX, which filed to list on Nasdaq on 12 June at a fixed price of $135 per share, implying a valuation of approximately $1.77 trillion. Let’s add some context: the company generated $18.7 billion in revenue in 2025, making the implied price-to-sales ratio somewhere above 90 times. Losses have ballooned – from a $791 million profit in 2024, the company turned to a $4.9 billion loss last year, largely because 76% of its capital expenditure (roughly $40 billion per annum) is now directed toward AI infrastructure rather than rockets. SpaceX is raising $75 billion. The valuation has more than doubled since December.
The fixed pricing structure is itself intriguing and worth examining. Traditional book-building allows price discovery; the market tells the company what it is worth. A fixed price does not. On the contrary, it tells the market what the company has decided it is worth and invites the public to agree. If the equity market deteriorates, a fixed-price deal carries more risk than its advocates typically acknowledge. There is no downward safety valve for adjustment.
More broadly, SpaceX is part of a pattern of IPOs. Anthropic has filed confidentially for a Q4 IPO at a valuation reportedly approaching $965 billion, having doubled its valuation in roughly two months. OpenAI recently raised $122 billion at a valuation of $852 billion. Combined, the three mega listings could require the market to absorb approximately $200 billion of new equity — a figure that exceeds the combined US IPO proceeds from all listings above $50 million between 2022 and the first quarter of this year. When the most valuable companies in the world are raising capital at this pace through equity issuance, it is reasonable to wonder about the founders’ assessment of their own valuations. They are, in aggregate, selling, and the market is buying. History suggests this asymmetry rarely ends well for the side with less information.
Oil: The Dog That Has Not Yet Barked
The Strait of Hormuz has been effectively closed since March. More than 11 million barrels per day (bpd) of production remains offline. Brent crude closed the week near $93 a barrel, elevated, certainly, but not the price one might expect from a supply shock of this magnitude. The explanation is not that the problem has been solved. It is that the world has temporarily absorbed it through a combination of mechanisms that are, without exception, finite.
Chart 3: Oil Price Not as High as Many had Feared – But There’s Still Time

Source: Bloomberg
So When Does the Price Finally Move?
The critical development last week was the sharp repricing of political risk. The implied probability that the Strait of Hormuz will reopen by August has collapsed from approximately 62% to 25% in a single week. That is not a gradual reassessment; that is the market revising a central assumption.
JPMorgan’s commodity team has pushed forward its projection for the onset of operational inventory stress from early June to late June. The distinction between commercial inventory and operational inventory matters here: not every stored barrel is usable. Pipelines, terminals, and refineries require minimum volumes to function. JPMorgan estimates global drawdowns have been running at roughly 8 million bpd and warns that, once the operational floor is approached, further drawdowns become physically difficult. The result, when it comes, would be explicit fuel rationing — particularly in Asia and Europe.
The mechanism for a sharp move higher in oil prices is therefore becoming clearer. When China normalises imports — from roughly 6.5 million bpd to 7.5 million bpd toward pre-crisis levels above 10 million bpd — that incremental demand will hit a market with substantially depleted buffers. Replenishing strategic reserves would amplify the buying. A counterintuitive possibility exists: if Hormuz does reopen, the immediate response might not be a sharp price fall, because China, refiners, and governments would all attempt to rebuild inventories simultaneously. The market has been far too generous in pricing the probability of reopening. That mispricing appears to be correcting.
US Inflation: The Bill Arrives This Week
The week’s principal market event is the May Consumer Price Index (CPI) report, due Wednesday. JPMorgan forecasts headline inflation of 0.58% month on month and 4.3% year on year — a sharp acceleration driven by higher fuel and energy costs. Core CPI is expected to rise 0.27% on the month and 2.9% annually. PPI is forecast at 0.7% on the month, reflecting higher costs of energy, freight, warehousing, and upstream goods.
The headline figure of 4.3% would pair with an employment report that showed decelerating wage growth. Average hourly earnings rose 0.3% in May, but annual growth has slipped to 3.4% from 3.9% in November, with the most recent three-month annualised rate at just 2.8% — near the weakest of the cycle. Real hourly pay would therefore be contracting at roughly 0.9 percentage points on those comparisons. That is a meaningful squeeze on household purchasing power, and it is happening now.
Chart 4: US Inflation Headed Above 4%
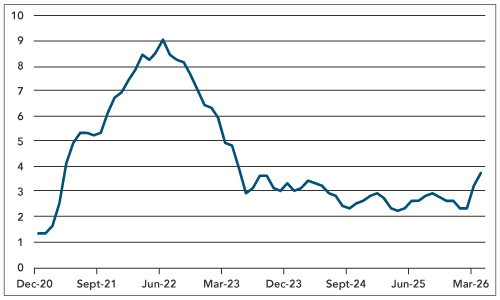
Source: Bloomberg
The employment report itself was better than the headline implied. May payrolls rose 172,000, with upward revisions lifting the three-month average to 188,000 — the strongest in over three years. But leisure and hospitality contributed 70,000 jobs, more than half of all private payroll gains, with restaurants alone adding 48,000. JPMorgan flags that the early timing of Memorial Day may have distorted seasonal adjustment, and notes that ADP, Homebase, Indeed, and job-opening data show less exceptional strength. The strong headline number is therefore not entirely to be believed, while the weak wage data very much can be.
The Fed finds itself in the familiar inflation-era bind. Markets are now pricing approximately 27 basis points of cumulative tightening by December, with the first hike increasingly anticipated in October—almost a year earlier than JPMorgan’s current forecast for rates to be increased in September 2027. The FOMC is expected to remove its implicit easing bias at the next meeting, and several policymakers are likely to project higher rates. Additional Section 301 tariff proposals — floating a minimum 10% levy on a wide range of trading partners — risk adding another layer of goods inflation. If these tariffs are additive rather than replacements for existing duties, the inflation outlook could worsen further.
The ECB: Raising Rates Into a Headwind
The European Central Bank meets on 10 and 11 June and is expected to raise its policy rate by 25 basis points. The decision is not indefensible — energy inflation is feeding through and second-round effects are a legitimate concern — but the context is uncomfortable. Euro-area growth data is dire, and tightening into an energy shock that is already compressing real incomes is an unusually blunt instrument. The central question is whether to treat the oil price surge as a temporary level shock or to pursue it with further rate rises that risk amplifying the economic damage. For European equities — already navigating weak demand, an energy shock, and trade uncertainty — tighter monetary conditions on top are not what the doctor ordered.
Allocation Bias
Our investing bias remains cautious on concentrated US technology exposure, wary of long-duration bonds, selectively constructive on energy and reform-oriented emerging markets, and supportive of maintaining more liquidity than usual. The SpaceX IPO and the broader pipeline of mega AI listings represent a further call on investor capital at a moment when risk appetite appears to be peaking. We are looking at late June as the point at which the temporary buffers that have so far kept oil prices in check could begin to fail. Until then, conditions will look deceptively stable. That stability should not be mistaken for safety.
Chart 5: European Equities not helped by Likely Rising Policy Rates

