May 5, 2026
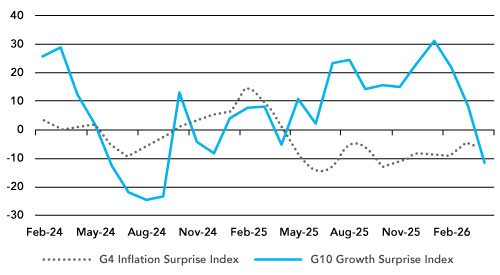
April was a month in which markets moved from hoping that the inflation shock would be temporary to accepting that policy may need to stay tighter for longer. Global growth momentum has been lost. Growth surprises have turned decisively weaker. Europe led the deterioration, and the aggregate G10 growth surprise index has now moved firmly into negative territory. The problem is that weaker growth has arrived at the same time as higher energy prices, higher long-term bond yields and a more visible pressure on household real incomes. That is not yet stagflation, but it is the sort of mix that makes markets less forgiving.
Chart 1: Global Economic Surprise Indices – Inflation and Growth
Index
Source: Bloomberg
The inflation story has also changed. For much of the past year, markets treated inflation as a fading issue. April made that harder. The war in the Middle East has moved energy, fertiliser and shipping costs back into the centre of the macro discussion. The World Bank now expects energy prices to rise 24% this year, with overall commodity prices up 16%, driven by energy, fertiliser and metals. The IMF’s April financial stability work also highlighted the combination of war risk, inflation pressure and tighter financial conditions as the key vulnerability for markets. The main event on inflation may therefore still be ahead of us, not behind us.
War and geopolitics
War remains the main macro swing factor. There has been a ceasefire framework, but not a durable settlement. Reuters reported that a ceasefire has been in place since 8 April, yet Iran continues to restrict access through the Strait of Hormuz in response to the US naval blockade of Iranian oil exports. That keeps around one-fifth of global oil and gas flows under direct market scrutiny. The US has also warned shippers against paying Iran for Hormuz transit, which tells us the dispute is now as much about sanctions, maritime control and revenue pressure as it is about military strikes.
The market impact is clear. Oil has tilted off the extremes, but it remains high enough to affect inflation expectations, corporate margins and central bank policy. The risks remain to the upside. Brent briefly traded above USD 126 before settling lower at the end of April, while Barclays raised its 2026 average Brent forecast to USD 100, citing prolonged Hormuz disruption and rapid inventory drawdowns. The risk is no longer just the spot price of oil. It is the second-round effect through jet fuel, freight, petrochemicals, fertiliser and food prices.
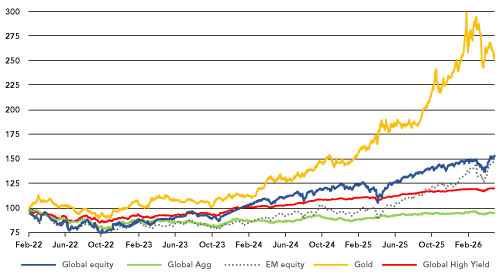
Asset Markets
Chart 2: Asset Class Performances
rebased to Feb ’22 =100
Equities
Equities rallied hard in April. It was not simply a US-led recovery. Asia ex Japan and emerging markets were the strongest country and regional performers, while the US and Japan also delivered strong gains. That tells us investors were prepared to add risk again once ceasefire hopes improved, but the leadership was broader than the narrow US megacap trade. LSEG Lipper data showed global equity fund inflows of USD 23.47 billion in the week after the ceasefire boost, nearly double the previous week’s inflow.
The US market remains heavily dependent on the AI and technology complex. Alphabet, Microsoft, Amazon, Meta, Nvidia, Broadcom and the wider semiconductor supply chain still dominate the earnings narrative. The April rally therefore had two engines: relief that the war had not yet moved into a wider regional conflict, and confidence that AI-related capital spending remains resilient. That said, the quality of the rally deserves scrutiny. JPMorgan cut its 2026 S&P 500 target from 7,500 to 7,200 in March, warning that markets were underestimating the oil shock and investor complacency. That call still matters because April’s price action was strong, but the macro backdrop deteriorated.
Japan remains one of the more interesting developed markets. The equity market continues to benefit from corporate reform, domestic reflation and foreign investor interest. However, the yen and the bond market are now part of the equity story. Japan is facing a rare combination of higher oil prices, higher domestic yields and currency weakness. The Bank of Japan held rates at 0.75%, but three policymakers reportedly favoured a hike, and the central bank warned that inflation could move materially above target under an oil-and-yen shock scenario.
Europe remains the weakest macro story among the main developed markets. Equity performance in April was respectable, but the region’s growth surprises have turned negative and energy sensitivity is still an issue. The rally therefore looks more like a valuation and positioning bounce than a decisive improvement in fundamentals. The UK continues to behave differently because of its sector mix. Its higher exposure to energy, banks and cash-generative companies gives it some protection in this environment, though gilts remain a constraint.
Chart 3: MSCI Emerging Markets relative to MSCI World Developed
rebased to May 2025= 100
Source: Bloomberg
China and India both require care. China has bounced, but the market still lacks a strong domestic demand impulse. India remains structurally attractive, but valuation discipline matters and the rupee has become a pressure point. Higher oil prices are a direct macro tax on India, widening the import bill and complicating the inflation and current-account picture.
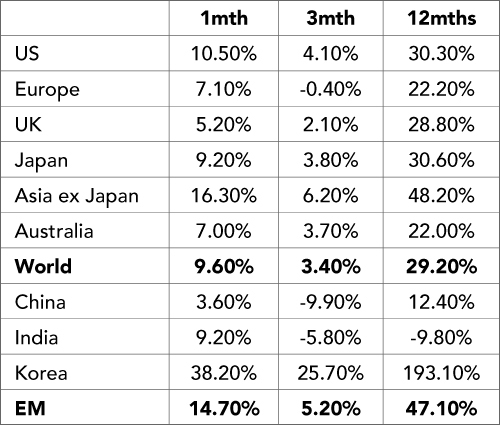
South Korea deserves a separate comment. A monthly return of around 38% is extraordinary for a major equity market and should not be treated as a normal country move. It reflects a powerful combination of AI-linked semiconductor demand, foreign inflows, corporate reform expectations and a sharp rerating of Samsung Electronics and SK Hynix. The Korean market has become one of the clearest global expressions of the AI infrastructure trade.
The rally has been narrow but rational. Samsung and SK Hynix together now represent more than 40% of the Kospi’s market capitalisation, so Korea is less a broad domestic economy trade and more a concentrated memory-cycle trade. SK Hynix reported a record quarterly profit in April, with earnings rising fivefold, and said AI chip demand would exceed manufacturing capacity. That helped reinforce the view that high-bandwidth memory is not just another short inventory cycle, but a structural bottleneck in the AI build-out.
There is also a policy angle. Korea’s “value-up” programme, aimed at improving governance and shareholder returns, has given foreign investors another reason to revisit a market that has historically traded at a valuation discount. April saw foreign buying return to the large semiconductor names, while the won also recovered modestly during parts of the month.
The caution is that a 38% monthly gain is not sustainable. Korea now carries concentration risk, AI capex risk and memory-cycle risk. The market has moved from cheap to crowded very quickly. For now, however, the move is telling us something important: investors are paying up for the owners of scarce AI capacity. Korea is not just participating in the global technology rally; it has become one of its main pressure points.
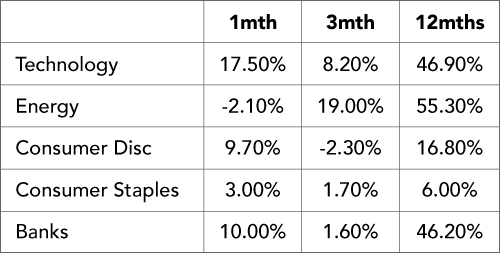
Table 1: Equity Market returns in April
Source: Bloomberg
Equity sector performance
The sector performance in April showed a clear preference for three areas: Technology and Banks. That combination is important. It tells us the market was not simply buying defensive assets, nor was it only buying long-duration growth. Investors were rewarding companies linked to AI infrastructure, energy scarcity and higher nominal activity.
Technology was the strongest sector in the month. The AI theme remains the main driver, but the story is becoming more complicated. It is no longer just about software, chips and cloud revenues. The investment debate is now moving into the physical infrastructure behind AI: data centres, power demand, cooling, semiconductors, copper, grid capacity and balance-sheet strength. The large US technology names still dominate the earnings story, but the second-order beneficiaries are becoming more important
Energy sector marked time in April although trading in a wide band. Sentiment towards sector has been highly correlated with the ebbs and flows of the war. At times many thought the war could be over soon, but that proved premature. Hence the sector saw a marked reversal of the early month fall. The move reflects the market’s recognition that the war and the disruption to energy flows have lifted the value of scarce capacity. The sector is not just responding to crude oil prices. It is also responding to pressure in LNG, refining, shipping, jet fuel, petrochemicals, fertiliser feedstocks and power generation. Energy is therefore acting less like a simple cyclical value trade and more like a real-asset cash-flow hedge.
Chart 4: Global Energy Sector, Sells off then Reverses
Source: Bloomberg
Banks also performed well. Higher-for-longer rates continue to support net interest margins, while stronger nominal growth can help revenues. The sector also benefits when yield curves steepen, provided credit losses remain under control. The risk is that bank earnings are a late-cycle indicator. Slower growth, higher energy prices and pressure on consumers may not show up immediately, but they can still feed through later into loan quality.
Consumer Discretionary recovered in April, helped by the broader equity rally and improved risk appetite. However, the sector remains more vulnerable than the monthly number suggests. Higher fuel, food and financing costs are a tax on household spending. The strongest names will be those with pricing power, affluent customer bases or clear brand strength. The weaker part of the sector is likely to be more exposed to margin pressure and weaker volumes.
Consumer Staples lagged the stronger cyclical and real-asset sectors. That is worth noting because staples are often treated as an inflation hedge. In practice, they are not always protected if input costs rise faster than pricing power. Food, packaging, transport and labour costs can all put pressure on margins. Staples still have defensive qualities, but April’s performance shows that investors preferred companies with direct exposure to scarce capacity rather than companies merely trying to pass higher costs on to consumers.
The overall message from the sector performances is that April was led by Technology, Energy and Banks. That mix supports the broader investment conclusion: the market is beginning to reward companies that own scarce capacity, control essential infrastructure or have pricing power in a higher-nominal-growth world. The old growth-versus-value framework is becoming less useful. The more relevant distinction is between users of scarce capacity and owners of scarce capacity.
Table 2: Sector Performances in April
Source: Bloomberg
Bond markets
Fixed income had a quieter headline month, but the underlying message was important. Bonds are no longer getting a clean tailwind from central banks. The Federal Reserve kept rates unchanged at 3.50% to 3.75% at its April meeting, but the tone shifted. The statement referred directly to Middle East uncertainty and the risks to both sides of the mandate. Several Fed officials have since argued that the central bank should move away from an easing bias because the oil shock has changed the inflation outlook.
Chart 5: Global Aggregate Index Struggles Against an Inflation Headwind
Global Agg Hedged (USD) Index
Source: Bloomberg
The yield curve also matters. US 10-year Treasury yields moved back towards 4.4% at month-end, with the 2-year yield around 3.9% and the 30-year yield briefly near or above 5%. The curve is no longer signalling a simple recession trade. It is signalling concern about inflation persistence, fiscal supply and the term premium. Long bonds are therefore not acting as the straightforward portfolio hedge investors hoped for at the start of the year.
Chart 6: US 2-year Bond Yield Rebound as Market View of Fed policy Flip-Flops
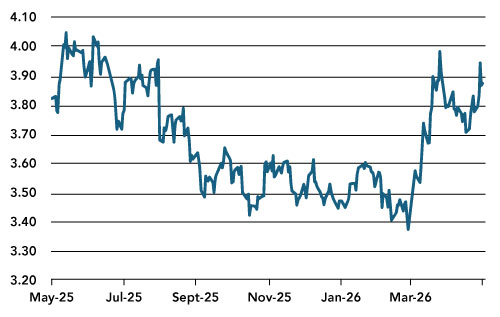
Source: Bloomberg
Europe is facing the same tension. The ECB left rates unchanged, but markets still priced at least two hikes by year-end after policymakers acknowledged the trade-off between higher inflation and weaker growth. German 10-year Bund yields moved above 3%, with reports of a 15-year high near 3.15%. That is a significant change for European asset allocation because it raises the hurdle rate for equities and private assets.
The UK remains under particular pressure. Inflation has picked up and the Bank of England’s April Monetary Policy Report warned that CPI is likely to rise further as energy costs pass through. Market participants no longer expect cuts this year, and the discussion has shifted towards whether policy may need to tighten again. UK 10-year gilt yields around 5% are a major signal. Britain is paying a high developed-market risk premium.
Credit performed better than government bonds, particularly global high yield and emerging market debt. That tells us investors are still prepared to earn carry where default risk is contained. However, this is not a free lunch. Higher oil, higher funding costs and weaker growth are a difficult combination for lower-quality
Table 3: Bond market returns In April ’26
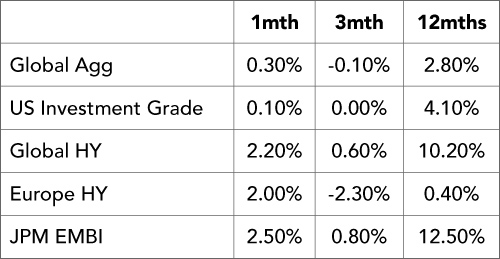
Source: Bloomberg
FX Markets
The dollar remains caught between safe-haven demand and structural concerns. In the near term, war risk, higher US yields and the Fed’s reluctance to cut rates should support the dollar. However, the medium-term risks have not gone away. The US still faces concerns around deficits, debt issuance and political pressure on the Fed. The dollar is therefore firm tactically, but no longer unquestioned strategically.
The euro has held up better than the European growth data would suggest. The reason is that the ECB is no longer clearly dovish. Higher energy prices are bad for European growth, but they also make it much harder for the ECB to cut. EUR/USD around the high 1.16 area after the ECB meeting tells us the market is not yet pricing a European policy capitulation, quite the reverse.
Chart 7: Euro/USD strengthens in April
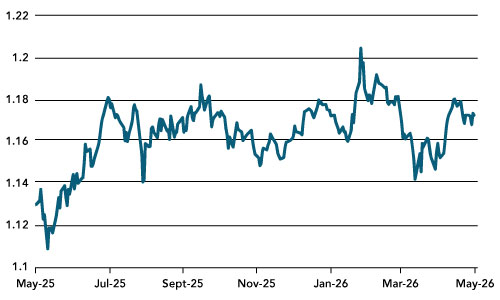
Source: Bloomberg
Sterling has been supported by the same logic. The Bank of England may not want to raise rates, but inflation is forcing it to keep the option open. GBP therefore has yield support, but the UK’s fiscal and external vulnerabilities remain a constraint. Sterling strength is more likely to come from relative rate support than from confidence in the growth story.
The Swiss franc remains the cleanest defensive currency in Europe. In a world of war risk, high energy prices and questions over central bank independence, CHF retains its safe-haven role. The issue is valuation. The franc is rarely cheap when investors need it most.
The yen is the more unstable currency story. Japan may have spent around USD 35 billion supporting the currency at the end of April, according to BOJ data cited by Reuters. USD/JPY was still around 156.5 at the time of the report. The problem is that intervention can slow a move, but it cannot easily reverse it if the interest-rate gap and the oil-import shock are still working against Japan.
The Australian dollar was supported by the stronger commodity backdrop, particularly copper and broader industrial metals, but the currency remains capped by concerns over China’s uneven recovery and Australia’s sensitivity to global risk appetite. For now, the AUD looks less like a pure carry trade and more like a liquid proxy for whether investors believe the commodity cycle has further to run.
For emerging market currencies, this was not an ideal backdrop. A stronger dollar, more expensive energy and weaker risk appetite usually create differentiation rather than a uniform collapse. Commodity-linked currencies can hold up better, while energy importers tend to suffer more. That distinction helps explain why equity performance within emerging markets was so varied. Brazil’s strength, for instance, was consistent with an environment in which commodity linkage and valuation support matter more than broad benchmark membership.
The Indian rupee is under clear pressure. The INR breached 95 per dollar at the end of April as higher crude prices and the US-Iran conflict hit sentiment. India imports most of its oil needs, so every rise in crude creates a direct pressure point for inflation, the current account and domestic rates. The RBI can smooth the move, but it cannot fully offset a large oil shock.
Chart 8: INR/USD a casualty of the Iran Crisis
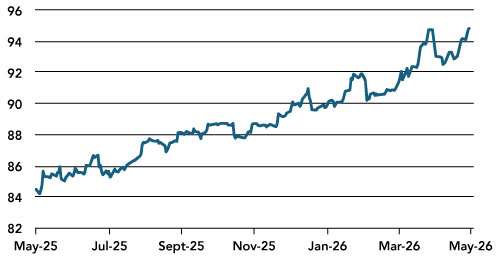
Table 4: Performance currencies versus USD as at 30th April ’26

Source: Bloomberg
Commodities
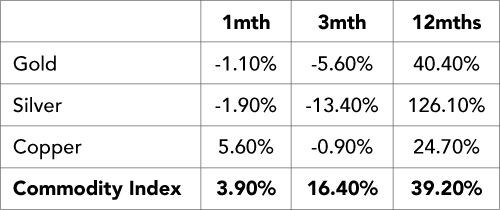
Commodities remain the cleanest expression of the current macro shock. The broad commodity index rose in April and remains strongly positive over 12 months. Copper was firm, helped by power demand, electrification, data centres and constrained mine supply. Gold and silver fell during the month, but the 12-month returns remain substantial. That looks like consolidation rather than a broken thesis.
The bigger issue is that the commodity story has widened. Gold is still a hedge against war, fiscal risk and central bank uncertainty. But the more specific hedge is real-asset cash flow and industrial bottlenecks. Energy logistics, fertiliser, copper, grid infrastructure, LNG, shipping and power generation are now central to the investment debate. April’s market action supports that shift. Investors are starting to distinguish between companies exposed to higher input costs and companies that own scarce supply.
Table 5: Performance of major commodity markets as at 30th April ’26