
Aug 5, 2025
In July 2025, the aggregate data played to good returns for equities and bonds. the global economic growth landscape exhibited a nuanced blend of resilience and underlying challenges. The ongoing front loading of activity as companies and to some degree consumers scarmbled to avoid the forthcoming impact of tarffs led ot stronger than expected growth.
Inflation trends showed a mixed picture. In the United States, inflationary pressures began to build gradually, partly due to the pass-through effects of tariffs on consumer prices. Conversely, in the OECD region, headline inflation declined to 4.0% in May 2025, down from 4.2% in April, marking the lowest level since June 2021. Despite these variations, central banks maintained a cautious stance, balancing the need to support growth with the imperative to control inflation.
Chart 1: Global Economic Surprise Indices – Inflation and Growth
(CESI Index – the degree to which economic growth and inflation data is above ro below expectations)

Source: Bloomberg
United States
July delivered a mixed picture for the U.S. economy. Headline GDP surprised to the upside with a 3.0% annualized Q2 print, yet underlying demand painted a more cautious picture: core final sales rose just 1.2%. At the close of the month and first day of August, labour market data provided a clear sign of cooling, with steep downward revisions to prior months leaving the three-month average at its lowest since the pandemic. The unemployment rate for June ticked up to 4.2%, and wage growth slowed to 3.7% year-on-year. Inflation, while easing, remained sticky, with the June PCE reading at 2.6%, and tariff-driven cost pressures beginning to filter into retail prices. Markets responded by increasing expectations for a rate cut in September, with futures now pricing in an 80% probability. The economic slowdown has not yet translated into financial stress, but the fragile equilibrium—rising costs, slowing jobs, and political noise—may yet tip the scales in Q3.
Europe
Europe’s economic narrative in July was one of cautious optimism. Eurozone inflation held steady at 2.0%, matching the ECB’s target for the first time since 2021, while core inflation edged slightly higher to 2.3%. This allowedthe European Central Bank to maintain its recent pause in rate changes following the June cut to 2%. Growth across the bloc remained subdued, with the German and French economies only marginally expanding. The broader EU benefited from a temporary easing in U.S.–EU trade tensions, but ongoing uncertainty around the auto sector and agricultural exports capped business investment. Survey data indicated improving services activity but stagnant manufacturing. Overall, the continent appears to be walking a fine line between stabilization and stagnation.
Japan
Japan’s economy entered a more fragile phase in July as real GDP growth moderated, and exports lost traction following an earlier surge in front-loaded shipments. Inflation remained stubbornly above the Bank of Japan’s 2% target, with core CPI (excluding fresh food) hovering between 3.0–3.5%. The Bank of Japan maintained its policy rate at 0.5%, though it raised its inflation forecast for fiscal 2025 to 2.7%, citing the pass-through of higher wage settlements.Politically, July’s Upper House elections delivered a setback to Prime Minister Ishiba’s ruling LDP–Komeito coalition, which lost its outright majority. While the chamber has limited legislative power, the result was seen as a referendum on the government’s handling of inflation and economic reform. It has reignited speculation about a possible snap election for the more powerful Lower House later this year.
Asia ex-Japan
The economic momentum across Asia (excluding Japan) showed notable divergence in July. Export-oriented economies such as South Korea, Taiwan, and Malaysia faced renewed headwinds from U.S. tariffs. The Asian Development Bank cut its regional growth forecast for 2025 from 4.9% to 4.7%, citing persistent trade uncertainty and weaker global demand. In contrast, domestic demand-driven economies like India, Indonesia, and the Philippines showed greater resilience. India, in particular, retained its 6.4% growth outlook, buoyed by robust services activity and infrastructure investment. China’s outlook was upgraded modestly by the IMF to 4.8% for the year, as consumer sentiment stabilized and some export orders recovered on easing trade frictions. Inflation remained subdued across much of the region, but policymakers stayed cautious, with several central banks opting to hold rates steady amid growing fiscal imbalances and volatile capital flows.
Chart 2: Emerging Market Surprise Indices Slip to Neutral

Source: Bloomberg
Asset Markets
Chart 3: Asset Market Returns (since Jan 22)
Rebased Jan 2022 =100

Source: Bloomberg
Equities
Global equity markets experienced a positive trajectory in July, with developed market equities rising by 1.3%, hitting new all-time highs. This uptick was driven by strong earnings reports from U.S. mega-cap companies and an improving growth outlook. Small-cap stocks also benefited in the early part of the month from the positive sentiment. Unlike the early part of the year, U.S. equity markets led the gains, while Europe saw some modest profit-taking. Asia (excluding Japan) also saw strong performance, particularly from Hong Kong, driven by easing worries over semiconductor tariffs.
Table 1: Equity Market returns in July

Source: Bloomberg
The latter part of July saw a shift in momentum, with smaller companies facing headwinds from renewed concerns over trade tensions and inflationary pressures. Despite these challenges, the overall equity market remained buoyant, supported by investor optimism and accommodative fiscal policies.
India performed poorly in July, continuing its trend of underperformance, exacerbated by a lacklustre quarterly earnings season. Brazil also saw a setback following an earlier run-up.
Equity sector performance
The Information Technology (IT) and Banks sectors continued to outperform. However, the Healthcare sector lagged, suffering from the threat of price caps on drug prices and ongoing disappointing earnings. For example, UnitedHealthcare, once a perennial large-cap outperformer in the U.S., is now down 44% over the past year.
Table 2: Global equity sector returns in July
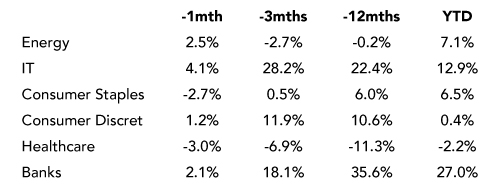
Source: Bloomberg
Bond markets
The bond market in July reflected a complex interplay of factors. Developed market government bond yields drifted higher, influenced by positive growth sentiment and expectations of continued economic expansion. In the United States, the Federal Reserve maintained its policy stance, keeping interest rates unchanged, which contributed to a stable yield curve.
Chart 4: US and JGB 30-year Bond Yields still High Creating Steep Yield Curves

Source: Bloomberg
Credit markets showed resilience, with spreads remaining relatively tight. High-quality bonds continued to offer attractive yields, particularly in the municipal bond sector, where long-duration bonds became more appealing due to historically favorable yields. Overall, the bond market demonstrated adaptability, balancing growth prospects with inflation concerns. Bond curves remained steep with 30 year bonds biased to moving higher.
Table 3: Bond market returns In July
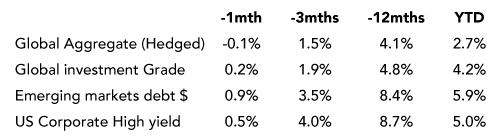
Source: Bloomberg
In the credit sector, high-yield bonds demonstrated resilience, but more modest returns as already tight spreads constrained capital returns. Indeed spreads went to record lows.
The JPMorgan Emerging Markets Bond Index (EMBI) Hard currency index experienced a healthy return of 0.9% in June, collecting its coupon and more. The EMBI spread for the dollar debt of EM sovereigns narrowed again month reflecting the ongoing appetite of global investors for EM debt.
Chart 5: US High Yield spread slips back lower (%)

Source: Bloomberg
FX and Precious metals
The U.S. dollar showed significant strength in July, with the DXY index rising by 3.2% over the month—its strongest monthly gain since September 2022. This resurgence was driven by a combination of risk aversion, softer economic data out of Europe and Asia, and rising expectations of prolonged U.S. policy rate differentials. Sterling lost ground to the dollar, dipping toward 1.26, on mixed UK data and softening expectations for further Bank of England tightening. Meanwhile, the Japanese yen remained under pressure, breaching 143 per dollar, reflecting the Bank of Japan’s reluctance to shift decisively away from ultra-loose policy despite elevated inflation.
In emerging markets, several Asian currencies saw renewed weakness amid widening trade deficits and outflows from local bond markets, particularly in the face of renewed dollar strength and heightened geopolitical risk.
Table 4: Monthly performance of precious metals and currencies for July 2025

Source: Bloomberg
The Gold price experienced significant volatility in July, reflecting investor sentiment amid economic uncertainties.However, in the early hours of August the weakness was emphatically reversed with the price of gold surged to $3,400 driven by more Presidential bluster.
Crypto currencies gain further acceptance
July 2025 was a landmark month for the cryptocurrency market, with Bitcoin (BTC) achieving an all-time high of $122,838 on July 14. By the end of the month, BTC remained solidly above $118,500, reflecting an 8% increase from the start of the month. Ethereum (ETH) also saw a remarkable surge, climbing by nearly 50% to close at approximately $3,800, marking its strongest monthly performance since 2021.
A key event in July was Galaxy Digital’s $9 billion sale of 80,000 BTC on July 25. Despite the scale of the transaction, the market absorbed it with minimal disruption, reflecting the growing maturity of the cryptocurrency market and increasing institutional participation. Furthermore, total cryptocurrency market capitalization surpassed $4 trillion for the first time on July 18, driven by strong gains in Bitcoin and Ethereum prices, continued institutional inflows via spot ETFs, and positive regulatory progress.
Ethereum’s performance was particularly striking, with spot Ethereum ETFs recording $5.43 billion in net inflows for July, a 369% surge compared to the previous month. This influx of capital was driven by growing institutional interest and the anticipation surrounding Ethereum’s upcoming ETF listings. Regulatory developments also played a significant role, with the SEC’s approval of in-kind creation and redemption for spot Bitcoin and Ethereum ETFs further cementing the growing legitimacy of the asset class. In conclusion, July 2025 marked a transformative period for the cryptocurrency market, highlighted by record-breaking price movements, substantial institutional inflows, and significant regulatory advancements. These developments signal the continued maturation of the cryptocurrency ecosystem and its increasing integration into the broader financial markets.
Chart 6: Bitcoin Slips Pass Gold

Source: Bloomberg
