

Share This

Macro and Markets Review for July 2026
Aug 3, 2026
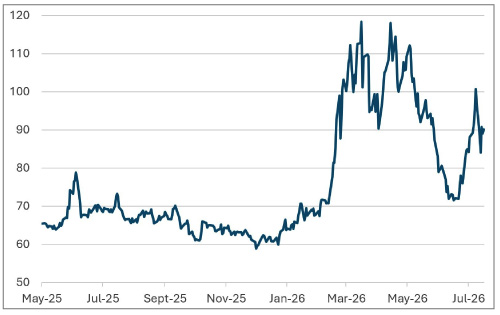
July was the month the Gulf crisis stopped being a fading story. The pause between Washington and Tehran collapsed, the Houthis opened a second front in the Red Sea and declared a blockade of Saudi shipping, Saudi forces joined US operations against Iran-backed groups in Iraq, and tanker loadings serving Kazakh crude in the Black Sea were suspended again after fresh attacks. For the first time in this conflict both of the Gulf’s principal export corridors were under simultaneous pressure. Brent rose more than 20% over the month to close near $88, having traded above $92, its strongest monthly gain since March. We had argued that the discipline worth keeping is to follow the ships, the refineries and the fuel prices rather than the diplomatic language. July vindicated that framing.
The inflation data published during the month described a world that had already ceased to exist. June CPI fell 0.4% on the month, the largest decline since April 2020, taking headline inflation to 3.5% from 4.2% and core to 2.6%. Core PCE eased to 3.3% from a three-year high. That relief was almost entirely energy, and energy has since reversed. July’s inflation prints will look considerably less comfortable, and the second-round costs, freight, war-risk insurance and refining margins, are still working through the system rather than fading from it.
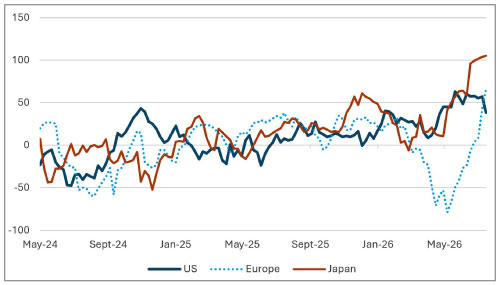
Growth is decelerating at the margin without breaking. US second quarter GDP came in at 1.5% annualised, down from 2.1%, and June payrolls were just 57,000. Yet the July flash composite PMI rose to an eight-month high of 53.6 on stronger services, and the industrial upturn has not gone away: the eurozone manufacturing survey held above 50 for a fifth month with Germany back in expansion, and Japan recorded its strongest quarter of factory activity since 2014. China went the other way, with July manufacturing slipping back into contraction for the first time since February. The direction of travel is a slower, more uneven expansion running into a fresh energy shock.
Chart 1: Global Economic Surprise Indices – Growth
Index
Source: Bloomberg
Central banks are now openly braced against inflation rather than growth. The Federal Reserve held at 3.50–3.75% for a fifth consecutive meeting on 29 July, but the vote was 9–3 with three dissents in favour of a quarter-point hike. The statement was again dramatically shorter than the pre-Warsh norm, forward guidance was withheld on the grounds that it is not suited to the current conjuncture, and the Chair insisted there is no soft inflation target while noting that tighter financial conditions are doing some of the Fed’s work. Markets read a hold as a hawkish event: the 30-year yield closed at its highest since 2007 and the Dow had its worst day in more than a year. The ECB can afford to pause with eurozone inflation at 2.8%; the Bank of England is holding with ten-year gilts around 5%; and the Bank of Japan, where a clear majority of economists now expect 1.25% by year-end, found the currency weakness, not the policy rate, forcing its hand at month-end.
The political calendar has become a market variable. The US midterms are now less than 100 days away, with the President’s approval near the lows of his term and the economy, principally prices and petrol, the dominant issue. The administration has a clear incentive to bank a Gulf settlement before November. That cuts both ways for investors: it raises the probability of a deal, and it raises the probability that a deal is announced before it is durable. Equity markets have learned to look through the headlines; bond markets have not, and are probably right not to.
Chart 2: Brent crude ($ bbl) – best monthly gain since March as both Gulf corridors come under pressure
Source: Bloomberg
Asset Markets
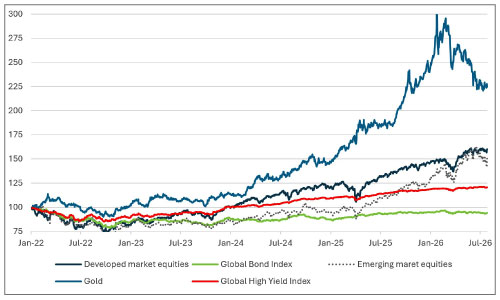
Chart 3: Asset Class Performances
rebased to Jan ’22 =100
Source: Bloomberg
Global Equities
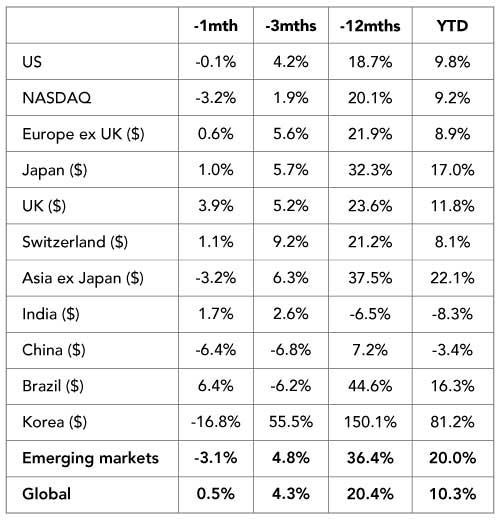
The global index rose 0.5% and the S&P 500 was effectively flat. That headline calm concealed the widest dispersion of the year. Beneath an unchanged index, the market did an enormous amount of work reallocating capital: energy and banks were bid hard, the AI supply chain was put on trial, and one of the world’s best-performing markets lost a sixth of its value in dollars.
The US was flat and the NASDAQ fell 3.2%, and it was not because earnings disappointed. Roughly 86% of S&P 500 companies beat estimates, with blended second-quarter earnings growth close to 38%. The problem was not the profits but the price of funding them. The sector leading global equity markets is no longer exempt from the cost of capital at precisely the moment it is becoming one of the largest borrowers of it. Hyperscaler bond issuance has gone from roughly $20bn a year between 2020 and 2024 to $109bn in 2025 and is tracking toward something closer to $300bn this year, with incremental debt rising from around 9% to roughly 32% of capex. Credit markets have priced that shift. Equity multiples had not.
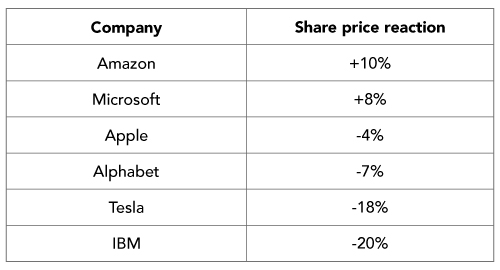
Investors have become genuinely discerning within technology, and the earnings season proved it. Five of the largest US technology companies reported inside seventy-two hours and were treated as if they were in different industries. Microsoft and Amazon were rewarded for attaching visible revenue to their spending; Alphabet was punished for raising capex guidance without it; Tesla and IBM were punished outright. The Magnificent 7 fell almost 6% in a single week, Microsoft is down more than 20% for the year, and Apple, up around 23%, has quietly become the largest single points contributor to the index. This is no longer a beta trade on artificial intelligence. It is a stock-picker’s market inside a single theme, and the discriminating variable is whether capital expenditure has a customer attached to it.
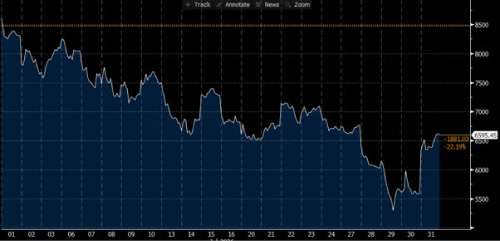
Emerging markets were overwhelmed by Korea. The Korean market fell 16.8% in dollars over the month and single-handedly dragged the emerging market index down 3.1%. The sequence was violent even by the standards of this year: a 6.4% fall on 16 July took the KOSPI into a technical bear market, roughly a quarter below its June peak; 28 July brought a 10.8% collapse; 29 July another 6% with an intraday low almost 13% down and a second consecutive circuit breaker; and then, on the final day of the month, a 14% surge, the largest one-day gain in the index’s history. Seven market-wide circuit breakers have now been triggered this year against thirteen in the mechanism’s entire history. The proximate causes were Chinese progress in memory chip production and scepticism about AI capital returns, but the deeper issue is concentration: a benchmark this exposed to two semiconductor names will always convert a change of global opinion into a domestic liquidity event, amplified this cycle by retail leverage and forced liquidations. It is worth holding two facts together. Korea lost a sixth of its value in July and is still up more than 80% in dollars this year.
Chart 4: KOSPI Index – Only a Partial Recovery from a Major Slump
Source: Bloomberg
China had its worst month in a decade. The market fell 6.4% in dollars, with the CSI 300 down 9.6% and the Shenzhen Component down more than 16%, the steepest monthly contraction since 2016. The irony is that this happened in the same weeks that China cleared several long-sought industrial milestones, including a domestic DRAM champion listing on the STAR market and reports of home-grown deep-ultraviolet lithography moving into production. The selling was not a verdict on Chinese technology. It was global AI supply-chain risk being taken off wherever it was held.
The UK was the strongest major market, up 3.9% in dollars. The FTSE 100 touched a record intraday high and closed the month at 10,868, its best monthly gain since February, with energy stocks adding more than 15%. This is the month in which the UK’s unfashionable index composition, heavy in energy, miners and banks, finally paid. The bond market told a less comfortable story, with ten-year gilts around 5.03%, some thirty basis points higher over the month.
Europe ex UK edged up 0.6% and Japan gained 1.0%. For Japan the equity return was almost a footnote to the currency, which is discussed below. Europe continues to grind out a respectable year on improving industrial data and undemanding starting valuations rather than on any change in its growth trajectory.
India and Brazil were the quiet positives. India rose 1.7%, its first constructive month in some time, though it remains down 8.3% year to date and a $90 oil price is once again a direct tax on the import bill, the currency and the inflation outlook. Brazil gained 6.4% as commodity linkage did what it is supposed to do in a month like this, reversing the pattern in May when Brazil failed to participate in a commodity rally.
Table 1: Equity Market returns to end July ‘26
Source: Bloomberg
Equity sector performance
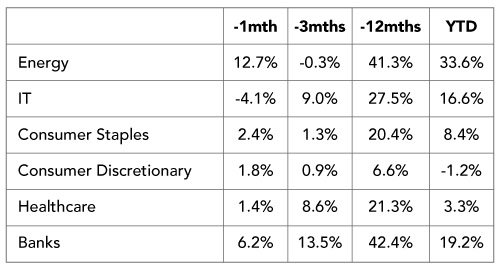
The sector table is the clearest description of the month. Energy rose 12.7% and is now up 33.6% year to date, restored to leadership by the Gulf escalation after giving back its first-quarter gains in the second. Banks added 6.2% and are up 42.4% over twelve months, supported by a steeper curve, resilient nominal growth and a reporting season that showed no credit accident underway. Information technology fell 4.1%, its first meaningful monthly setback of this cycle, though it remains up 16.6% for the year.
If May was the month in which no Magnificent 7 stock made the top of the leaderboard, July was the month in which the group stopped trading as a group at all. Five of them reported inside seventy-two hours and the market delivered five different verdicts.
Table 2: Same theme, opposite verdicts – post-earnings share price reactions, late July
Source: Bloomberg, company reports. Reaction measured on the first full trading session after results.
The defensives quietly did their job. Consumer staples rose 2.4%, healthcare 1.4% and consumer discretionary 1.8%. None of that is exciting, but in a month when the index went nowhere and the growth engine de-rated, modest positive returns from sectors nobody wanted to own were worth having. The rotation was not a risk-off move. It was a rotation from assets valued on the future to assets valued on current cash flow, which is what higher real discount rates are supposed to produce.
Bond markets
As confidence built that inflation was coming down and central banks delivered on rate cuts, bonds rallied. This translated into more of a general drop in yields rather than any significant performance from the credit market. Credit spreads remain essentially unchanged.
Table 3: Global Sector Performances in July ‘26
Source: Bloomberg
Bond markets
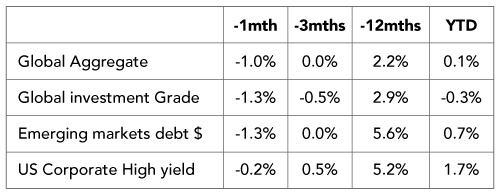
Every major fixed income segment lost money. Global aggregate bonds fell 1.0%, global investment grade 1.3% and emerging market debt 1.3%. US corporate high yield was the least bad at ‑0.2%. That ranking matters: spread, not duration, was the protection. Credit outperformed governments in a month when the government curve was the problem, which tells us investors are still not pricing a default cycle, only a higher cost of money.
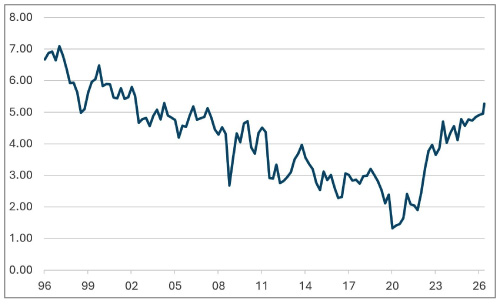
The move was a bear steepening, and that is a specific diagnosis. The two-year yield sat around 4.33% at the time of our 27 July weekly, close to the top of its post-pandemic range and almost a full point higher than February. The ten-year followed to around 4.65% and the thirty-year closed above 5.19%, the highest since 2007. Futures now discount roughly 60 basis points of further tightening over the coming year, from a market that began 2026 positioned for cuts. Long-end yields rising faster than the front end, alongside a weaker dollar, is not a growth signal. It is the market charging a higher premium for inflation persistence, fiscal supply and the financing needs of an AI capital cycle that is increasingly funded in the bond market.
The valuation arithmetic is the uncomfortable part. Over the past eighteen years the two-year Treasury yield has spent only around 18% of the time above 4%. The last sustained period at these levels, in the mid-2000s, saw the S&P 500 trade on roughly 15 times earnings. It is close to 22 times today. Higher yields do not require a recession to close that gap; absent one, they simply make the multiple progressively harder to defend. Gilts at 5% and a fifteen-year high in the German ten-year bund say the same thing in other currencies.
Chart 5: Bear steepening – 30-year Treasury yield at its highest since 2007
Source: Bloomberg
Table 4: Bond market returns to end July ’26
Source: Bloomberg
FX
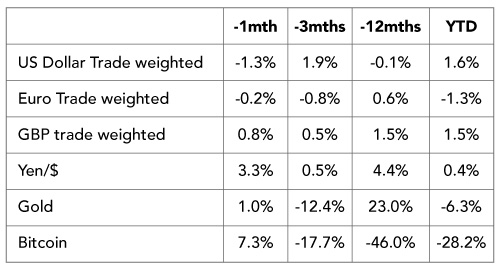
The dollar fell 1.3% on a trade-weighted basis. That is genuinely notable. A month containing a war escalation, a 20% oil move and a hawkish central bank would normally be a dollar month, and it was not. Rising long yields with a falling currency is the classic signature of a market demanding compensation for fiscal and inflation risk rather than seeking refuge. The dollar remains up 1.6% for the year, so this is a wobble rather than a regime change, but it is the kind of wobble worth monitoring.
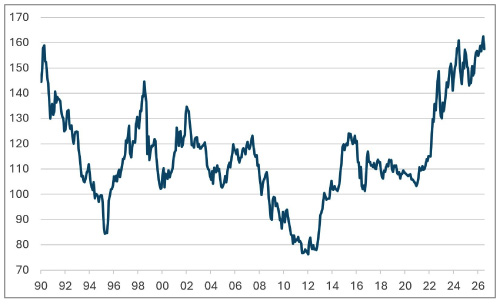
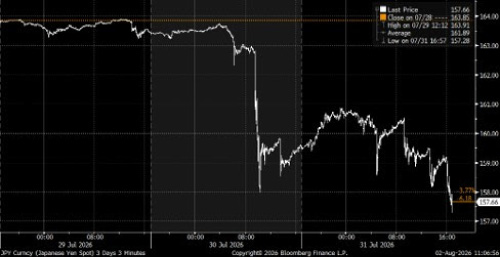
The yen was the month’s main event, and it ended in coordinated intervention. The currency broke through ¥163 and approached ¥164 to the dollar, its weakest since 1986. Japanese authorities intervened on 30 July, with Bank of Japan data implying sales of as much as $59bn. On 31 July the US Treasury joined, with the New York Fed selling euros to buy yen on its behalf through Goldman Sachs and Morgan Stanley. This is the first time the US has intervened to support the yen since the coordinated G7 action of 2011. The yen gained more than 1% against both the dollar and the euro and ended the month around ¥158, up 3.3% over the period.
The significance is political as much as technical. Washington has decided that yen weakness is now its problem too, and the July Treasury currency report describing the yen as substantially undervalued gave the action a framework. What intervention does is punish one-sided positioning; what it does not do is change the interest rate differential that created the position in the first place. That is the Bank of Japan’s job, and the market now expects policy at 1.25% by year-end. For Japanese equities the implication is a subtle change of character: the yen tailwind that flattered exporters is being deliberately removed, while imported energy costs remain the reason it had to be.
Chart 6: Yen/$ – a four-decade low, then coordinated intervention
Source: Bloomberg
Sterling and the euro were largely uneventful. Sterling gained 0.8% trade-weighted, helped by high gilt yields and an energy-heavy equity market, though a 5% ten-year yield is compensation for fiscal and political risk as much as for inflation. The euro slipped 0.2%, caught as usual between adequate growth data and a central bank with limited room to be helpful.
Bitcoin rose 7.3% but remains down 28.2% this year and 46.0% over twelve months. A monthly gain in a month of war escalation and equity stress will be presented as evidence of hedging properties. It is not. Over any horizon that matters it has behaved as a high-beta liquidity asset, and the Korean episode was a useful reminder: when retail equity positions are liquidated, crypto volumes contract with them rather than absorbing the flow.
Table 5: Currencies and precious metals – to end July ‘26
Source: Bloomberg
Commodities
Oil was the month’s dominant asset. Brent rose more than 20% to close near $88 after trading above $92, its best month since March, as the US and Iran resumed strikes, the Houthis blockaded Saudi shipping in the Red Sea, and Kazakh export loadings in the Black Sea were suspended following attacks on tankers. Saudi Arabia has convened representatives of more than forty countries to discuss a maritime coalition, which is itself an indication of how far normalisation remains away. Tanker traffic through Hormuz has continued, but the Revolutionary Guards turned vessels back during the final week.
The cost of the crisis is increasingly in the freight invoice rather than the crude price. VLCC day rates on Gulf routes have roughly doubled to above $60,000, war-risk insurance premiums are at levels not seen since the tanker wars of the 1980s, and the European diesel crack has widened to around $35 a barrel against a pre-conflict range of $20 to $25. European diesel inventories sit some 8% below their five-year seasonal average. These are the mechanisms through which a geopolitical event becomes a core inflation problem, and they unwind slowly. Even a credible settlement would deliver quick relief on crude and slow relief on everything downstream of it.
Gold rose just 1.0% and remains down 6.3% for the year, though still up 23.0% over twelve months. A war escalation, a hawkish Fed and a weaker dollar in the same month would ordinarily be a strong combination for bullion, and it delivered almost nothing. Gold is still digesting the repricing that followed the change at the Federal Reserve and the punitive import duties applied across Asia earlier in the year. The strategic case is intact; the momentum is not, and investors should be careful not to treat a twelve-month number as a description of the current trend.
Bottom line
July was the month in which the two things that made this cycle comfortable, cheap capital and tolerable energy prices, became more expensive at the same time. The indices barely moved, which flatters the month considerably. Underneath, energy and banks were rewarded, the AI supply chain was made to justify its funding costs stock by stock, Korea demonstrated what happens when a concentrated bet meets a change of global opinion, and the world’s two largest economies had to intervene jointly in a currency market.
Three questions decide August. Whether July’s oil move shows up in core prices and inflation expectations, in which case three Fed dissenters could become four. Whether the technology sector can keep growing its capital spending while the bond market charges more for it. And whether the administration secures a Gulf settlement before the midterms, and if it does, whether markets treat that as relief or as the beginning of an argument about how slowly shipping, insurance and inventories actually normalise. On the evidence of this month, the first reaction would be relief and the second would be stickier inflation than anyone would like.