

Share This

Macro and Markets Review for Q3 2026
Oct 5, 2026
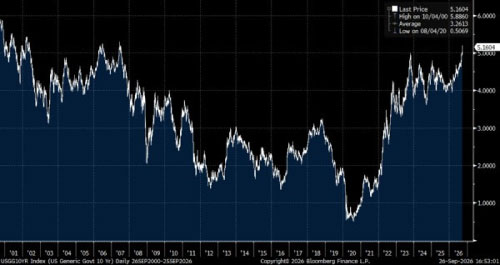
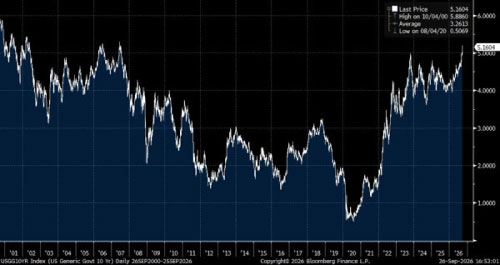
September was the month the bond market caught up with reality. Global growth stayed strong (stronger than central bankers would like), inflation remained stubbornly above target and the Middle East conflict pushed oil decisively back above $100 a barrel. The result was a sharp repricing of the price of money. The US 10-year Treasury yield rose by roughly half a percentage point over the month, its steepest monthly rise in three years, and finished September close to 5.3%, a level not seen since 2007. The 30-year yield touched its highest level since 2002. Equities barely flinched: the S&P 500 ended the month almost flat and the Nasdaq 100 hit a record on the same day that 10-year yields broke higher. That gap between what bonds and equities are pricing is the defining feature of the month, and gaps like that rarely persist.
Chart 1: US 10-year Treasury Yield – Highest Since 2007
Source: Bloomberg
Global growth is now the problem, not the solution. Our weekly work described it as “good news, wrong kind”. J.P. Morgan’s global composite PMI tracked a 3.1% annualised pace in August, September’s flash composite PMIs reached a four-year high and the Atlanta Fed’s GDPNow model is signalling US growth close to 5% in the third quarter. Capital spending remains the engine: US core capital goods orders are up 14% year-on-year and Korea’s September exports rose 83.5% to a record on the back of chip shipments. Europe, the weak link earlier in the year, has held up better than expected, helped by German fiscal stimulus. This is not stagflation. It is an expansion running hot enough to force central banks’ hands, with its rewards landing narrowly among asset owners rather than across households.
The inflation challenge is proving structural rather than residual. US core PCE inflation has run above 3% for most of the year and the Fed’s own projections have core PCE ending 2026 at 3.4%. A softer-than-expected August PCE report on the final day of the month, with core at 3.0% after methodological revisions, gave bonds some brief relief, but it does not change the bigger picture. AI-driven capex, tight labour markets, sustained fiscal deficits and a renewed energy shock are all pushing in the same direction. Pipeline pressures extend well beyond oil: copper is up around 50% this year, freight and insurance costs remain elevated and a strengthening El Niño adds risk to food and power prices. In Europe inflation has persisted to the concern of the ECB.
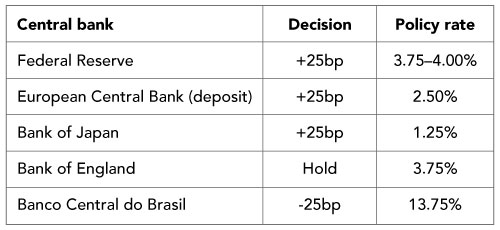
The Fed turned around and raised rates. On 16 September the FOMC voted unanimously to raise the fed funds range by 25bp to 3.75–4.00%, its first hike since 2023. The dot plot was more hawkish than expected: 16 of 18 participants see at least one further increase this year, and the median of 4.1% for end-2026 implies one more hike, most likely by December. Regional Fed presidents were uniformly hawkish in the final week of the month, and New York Fed President Williams called another hike by year-end a reasonable expectation. Earlier in the year markets were debating how many cuts to expect. They are now debating how high rates must go before policy is genuinely restrictive.
This is a synchronised tightening. The ECB raised its deposit rate by 25bp to 2.50%, explicitly citing the Middle East conflict alongside persistent inflation. The Bank of Japan raised its policy rate to 1.25%, with Governor Ueda declaring that the “policy phase has changed”, and Japan’s 10-year yield moved above 3% for the first time in roughly three decades. The Bank of England held at 3.75%. Easing is now confined to emerging markets with very high real rates: Brazil cut the Selic to 13.75% on the same day the Fed hiked. Higher rates simultaneously in the US, Europe and Japan tighten the global price of capital in a way a Fed move alone would not.
Table 1: Central Bank Action in September ‘26
Source: Central banks
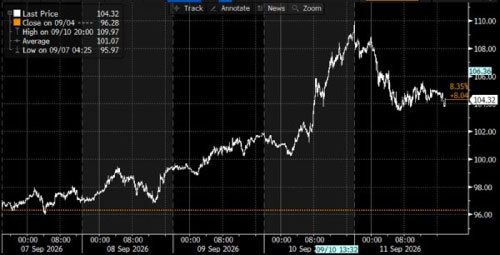
In the Middle East, the market finally understands that the Iran crisis is far from solved. A rapid Houthi advance in Yemen opened a second front near the Bab el-Mandeb, threatening two of the world’s key energy corridors at once. Drone attacks on 10 September shut Saudi Arabia’s East-West pipeline, the main route that bypasses Hormuz. Brent moved emphatically through $100 and touched $108 intraday on 24 September after Houthi missiles targeted Saudi Arabia. Diplomacy has not died: US–Iran talks continued through Qatari mediators on the sidelines of the UN General Assembly, and Iran floated a seven-day plan to reopen Hormuz, which President Trump rejected. A fresh US response was under review in Tehran as the month closed. The uncomfortable conclusion is that markets have stopped assuming the conflict will end when it suits them.
Chart 2: Brent Oil Price Emphatically Through $100
Source: Bloomberg
Washington is becoming the other swing factor. Democrats widened their generic-ballot lead from under 7 points to around 9 during September, and prediction markets now see Democratic control of the House as highly likely, with the Senate leaning the same way. That matters beyond tax and regulation: a hostile Congress controls war funding, the lever that ultimately ended US involvement in Vietnam. President Trump has floated an Iran deal landing after the 3 November vote. Political noise will intensify into the election, a source of tail volatility not obviously reflected in current pricing.
For portfolios, the message is that the price of money matters again. With US 10-year yields above 5%, bonds are now real competitors to equities and cash is no longer an admission of defeat. As in 2006, resilience to tighter policy is not evidence that it does not matter; the lags may simply not have run their course. We favour short duration, avoiding weaker credit, not chasing US equities and looking to Asia for growth without the same fiscal excess.
Asset Markets
Source: Bloomberg
Chart 4: MSCI Korea relative to MSCI World +10% in two months
rebased to August 3rd 2026 = 100
Source: Bloomberg
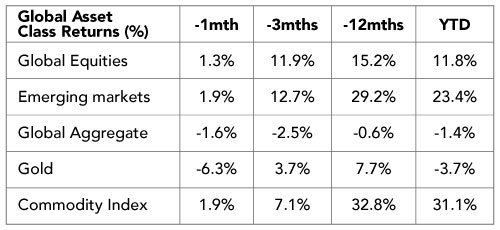
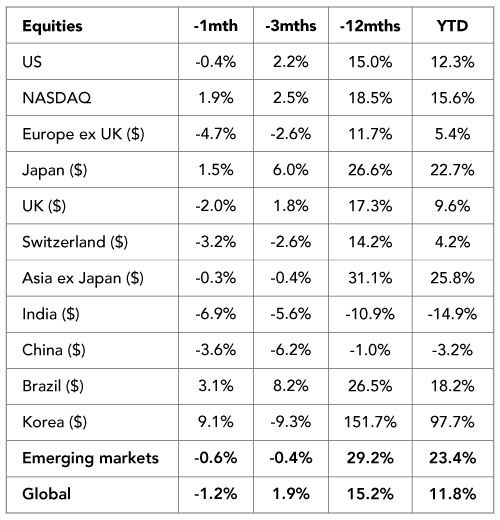
Global equities slipped modestly, but the more important message is what did not happen. The global index fell 1.2% and the US was broadly flat, yet the NASDAQ rose 1.9% in a month when 10-year yields jumped by around 50bp. Long-duration growth stocks should have been the most exposed to a higher discount rate. Instead, AI earnings carried them. The S&P 500 now trades on around 19 times forward earnings while investors can earn close to 5% risk-free; for the first time in years there is a real price to pay for owning equities.
Korea was again the standout, rising 9.1% in dollar terms. It remains the purest expression of the AI memory cycle, now up 97.7% year-to-date and more than 150% over twelve months. Record exports and results from Micron confirmed that the memory shortage is tightening rather than easing, with customers locking in supply years ahead. But the three-month figure of -9.3% is a reminder of July’s rout, and foreign investors were heavy net sellers during September, concentrated in Samsung Electronics and SK Hynix. With two stocks accounting for more than half the index, Korea is spectacular but volatile.
Japan rose 1.5% in dollar terms, helped by a firmer yen after the Bank of Japan’s hike. Corporate reform and the return of domestic inflation keep the structural case intact, but JGB yields above 3% mean the equity market performance is now firmly linked to the bond market.
Europe was the weakest developed region. Europe ex UK fell 4.7% and Switzerland 3.2%, with UK equities down 2.0%. The ECB hiking into an energy shock, a weaker euro and renewed fiscal anxiety in France, where economists forecast that public debt may reach a record 119.3% of GDP and OAT–Bund spreads have widened, all weighed on investor sentiment towards the region. Valuation support remains, but the catalyst is missing.
India and China lagged badly within emerging markets. India fell 6.9% and is now down 14.9% year-to-date. Oil above $100 is a direct tax on India through its import bill and inflation, the rupee hit a record low beyond 96 to the dollar and foreign portfolio investors continued to sell. China fell 3.6%. The Trump–Xi summit in Washington produced limited deliverables: an extension of the truce on rare earth export controls and tariffs, a new dialogue on AI and plans for two further meetings this year. That is managed vulnerability rather than a turning point, and domestic demand remains weak despite stabilising PMIs.
In EM Brazil was a rare bright spot, up 3.1%. The central bank cut the Selic to 13.75% hours after the Fed hiked, the real held firm and commodity exposure helped. The next test is close at hand: the general election on 4 October, with polls showing a statistically tied runoff between President Lula and Flávio Bolsonaro and Brazil’s equity volatility gauge at a record high in the final days of the month.
Table 2: Equity Market returns to end September ‘26
Source: Bloomberg
Equity sector performance
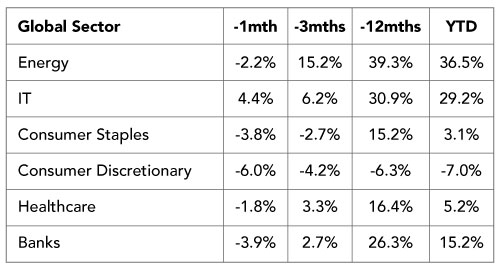
The sector picture was unusually one-sided. Information technology was the only sector to rise, gaining 4.4% and taking its year-to-date return to 29.2%. The market is still willing to pay for visible AI earnings, particularly in memory, storage and semiconductors. But the next leg of the story will be more selective. Higher rates will not stop companies buying computing power where the underlying return is real, but they will expose weak business models and stretched financing structures. As our bond section shows, the AI boom is increasingly a credit story as well as an equity one.
Energy fell 2.2% despite Brent trading above $100 for much of the month. Equity investors were reluctant to capitalise war-premium oil prices, particularly with peace talks under way, and the sector consolidated after a powerful run. It remains the best-performing sector year-to-date, up 36.5%.
Consumer discretionary was the weakest sector, down 6.0% and now negative year-to-date. Mortgage rates around 7% have crushed housing affordability, homebuilders are leaning on incentives that squeeze margins, and spending growth is concentrated among asset owners benefiting from the equity wealth effect. Higher financing costs bite hardest outside that group.
Consumer staples fell 3.8% and banks were down 3.9%. Staples were repriced as bond proxies, as were utilities, now down nearly 20% from their peak. Banks should benefit from steeper curves, but investors are watching credit risk more closely. Investors should keep the order of events in 2006/7 in mind. Steep yield curves as Fed pressed on with tightening of policy, followed by concerns about growth. Growth fears build, defaults build and banks are in trouble. Investors should remain vigilant of trouble in the credit markets. Healthcare slipped 1.8% and remains very much a stock-selection sector.
Table 3: Global Sector Performances in September ‘26
Source: Bloomberg
Bond markets
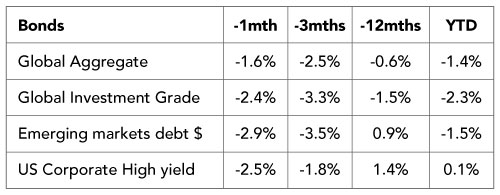
Bond markets had a very difficult month, with every major index in negative territory. Global aggregate bonds fell 1.6%, global investment grade 2.4%, emerging market debt 2.9% and US high yield 2.5%. All four are now flat to negative year-to-date. Our weekly work drew the comparison with 1994, when investors discovered that diversified government bond portfolios could all fall together when the price of money rises everywhere at once.
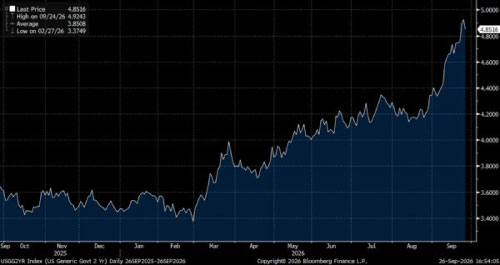
This was an emphatic structural break in the US bond market. The 10-year Treasury broke above 5.15% in the final week of the month and the MOVE bond volatility index jumped almost 30% in five days. The most telling move was in the market’s estimate of the neutral interest rate three years out, which rose by around 50bp in a single month. That is a repricing of the medium-run structural rate, not just the near-term policy path. Real yields rose almost as much as nominal yields, and the 2-year yield repriced by close to 60bp in a matter of weeks, finishing the month near 4.9%.
Chart 5: US 2-year Bond Yield Reprices, Almost Violently by Near 60bps in a Matter of Weeks
Source: Bloomberg
Supply matters as much as the Fed. AI-linked companies have issued more than $500 billion of debt this year, total US corporate issuance is running about 30% ahead of last year, and developed-economy governments paid over $3.3 trillion in interest last year. Meanwhile the marginal buyer of Treasuries is shifting from official reserve managers in Japan and China towards leveraged private capital. Heavy issuance into a less dependable buyer base demands a higher term premium.
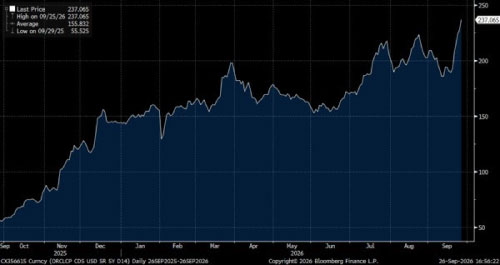
Credit is cracking at the edges. Oracle’s 10-year bond yield rose to 7.34%, against 5.73% at issue in February, and its five-year CDS reached a record 237bp, wider than at the peak of the 2008 crisis, after reports that the company was seeking to invoke force majeure on a data-centre lease tied to its Stargate build-out. Meta, Amazon and Microsoft credit also widened even as their equities hit highs, and high-yield spreads ended the month at their widest since April. None of this is systemic yet, and Big Tech balance sheets remain enormous cash generators. But credit leading while equities lag is exactly the sequence worth watching, because it is usually credit that signals first when a financing boom has outrun its cash flows.
Chart 6: Oracle 5-year CDS (bps) – AI Financing Becomes a Credit Story
Source: Bloomberg
Emerging market debt was the weakest bond asset class, hit by the combination of higher US yields and a stronger dollar. Energy importers such as India remain the most vulnerable, while commodity exporters and countries with high real rates, such as Brazil, are better placed . Currency differentiation will matter more than benchmark exposure.
Table 4: Bond market returns to end September ‘26
Source: Bloomberg
FX
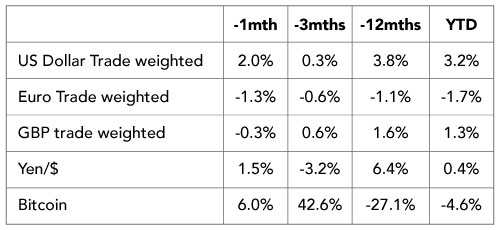
The dollar rose 2.0% on a trade-weighted basis. A Fed that is hiking, Treasury yields at their highest since 2007 and a war that keeps oil above $100 is close to an ideal tactical mix for the dollar. Liquidity preference still sends investors to dollars first. The structural debate about fiscal deficits and reserve diversification has not gone away, but for now the negatives are overwhelmed by the interest rate support.
The euro fell 1.3% despite the ECB’s hike. Weak regional equities, French fiscal concerns and Europe’s exposure to imported energy outweighed the policy move. Sterling slipped 0.3% as the Bank of England held and gilts joined the global long-end sell-off.
The yen rose 1.5% against the dollar, helped by the Bank of Japan’s hike, signs of US concern over yen weakness and JGB yields above 3%. It is still down 3.2% over three months, and higher domestic yields are beginning to change the calculus for Japanese investors who have long recycled savings into Treasuries.
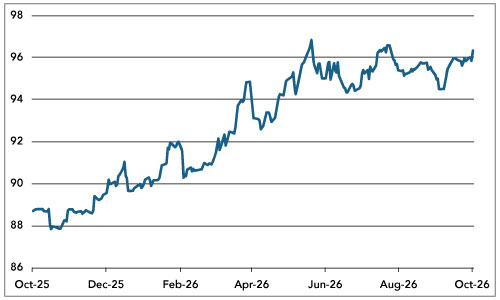
The Indian rupee fell to a record low, slipping beyond 96 to the dollar. India’s problem is unchanged and intensified: oil above $100 feeds directly into the import bill and inflation, while 5% US yields draw portfolio flows out of emerging markets. Foreign investors were persistent sellers of Indian equities through the month.
Chart 7: INR/USD at a Record Low
Source: Bloomberg
Bitcoin rose 6.0% and is up 42.6% over three months. The message is less about crypto than about liquidity: speculation is alive even as the Fed hikes, and central bankers can reasonably conclude financial conditions are not yet tight enough. Bitcoin remains down 27.1% over twelve months, a high-beta liquidity asset rather than a hedge.
Table 5: Currencies – to end September ‘26
Source: Bloomberg
Commodities
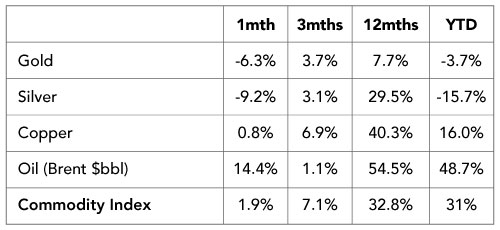
Gold fell 6.3% in September and is now down 3.7% year-to-date, roughly a quarter below its late-January record. The explanation is straightforward: US real yields rose at their fastest pace in four years and the dollar strengthened, raising the opportunity cost of holding a non-yielding asset. Not even oil above $100 and an unresolved war could offset that. The strategic case for gold, built on reserve diversification and geopolitical risk, is intact, but bullion is likely to struggle until real yields peak.
Oil was the dominant commodity story. Brent pushed through $100 and spiked above $108 intraday on 24 September before peace-talk headlines pulled it back. The risk is now persistent supply impairment rather than a single spike: Goldman Sachs warns Brent could exceed $120 next year if Gulf output stays well below pre-war levels. Copper remains the structural scarcity story, up around 50% this year as electrification, data centres, defence and grid investment collide with slow mine supply.
Table 6: Performance of Commodities to end September ‘26
Source: Bloomberg
Bottom line:
September marked a regime change in the price of money. The Fed has joined the ECB and the Bank of Japan in raising rates, with one more US hike likely before year-end, and the US 10-year yield has broken above 5% for the first time since 2007. The reason is not weakness but strength: global growth is running hot enough, and inflation is proving sticky enough, that central banks see no need for a growth sacrifice yet. Equities have so far shrugged this off, but credit spreads are beginning to widen at the edges of the AI financing boom, and the Middle East and the US midterms add two genuine swing factors into November. The global economy is still remarkably healthy. Increasingly, that may be the reason investors should be careful rather than comfortable.