


Share This

Calm Markets, Fine Margins
Jul 13, 2026
The Gulf conflict is neither over nor escalating in a straight line. Ceasefires have become pauses. Military actions keep happening without triggering the economic collapse many feared. The better guide to how to react isn’t the political noise, it’s how the conflict transmits through energy prices, trade, inflation and corporate earnings.
Over the weekend, the United States launched another major series of strikes against Iranian military targets after a commercial vessel was damaged in the Strait of Hormuz. Iran responded with attacks on several Gulf states and again declared the Strait closed. Diplomatic efforts continue.
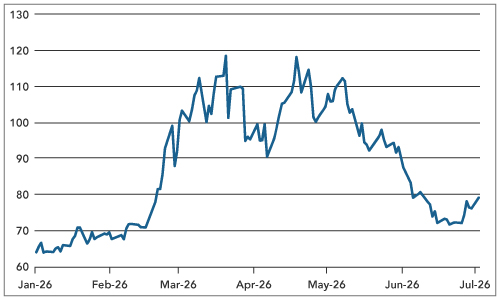
Markets were remarkably calm last week. US equities rose modestly, the VIX fell to around 15, and Brent crude closed above $76 per barrel. Those prices pre-date the weekend’s escalation, so they’re not a final verdict. But they show that investors have stopped reacting to whether missiles are flying. They will now try to assess whether those missiles are changing the economic outlook.
Chart 1: Oil prices calm
Index
Source: Bloomberg
Geopolitical events can be tragic without immediately becoming systemic for financial markets. Markets price change based on changes in cash flows, inflation and the probability of disruption. The Gulf conflict becomes a global market event again when it meaningfully interrupts the movement of energy and goods. Until that threshold is crossed, markets appear willing to look through repeated escalations..
Watch the Pipes, Not the Press Release
The Strait of Hormuz is the critical transmission point. Roughly one-fifth of the world’s oil and gas flows through it but what matters is whether vessels actually stop moving, insurers withdraw cover, tanker rates spike and refiners can’t get supply.
Five indicators remain more than the daily headlines:
Vessel traffic through Hormuz. Tanker movements are running roughly 15-20% below their pre-conflict baseline, with the most significant drop in LNG carriers as operators reroute around the Arabian Sea. That’s a meaningful reduction, not a closure — but the direction of travel matters as much as the current level.
Tanker charter rates and maritime insurance costs. VLCC day-rates have roughly doubled since the conflict intensified, now running above $60,000 per day on Middle East Gulf routes. War-risk insurance premiums have risen to levels not seen since the tanker wars of the 1980s, adding an estimated $1-2 per barrel to the effective cost of Gulf crude for Asian buyers. These costs didn’t disappear when a ceasefire was announced — insurers reprice slowly and cautiously.
Refinery availability and refined-product inventories. European diesel inventories are around 8% below their five-year seasonal average. US distillate stocks are similarly thin. Asian refinery throughput has been constrained by feedstock uncertainty — refiners are running at reduced utilisation not because crude is unavailable but because forward supply visibility is too uncertain to justify full runs.
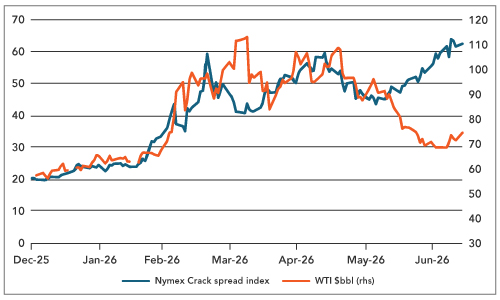
Diesel, jet fuel and fuel-oil prices relative to crude. The European diesel crack spread has widened to around $35 per barrel, well above the $20-25 range before the conflict. Jet fuel cracks have followed. This divergence between crude and products is the clearest market signal that the supply chain, not just the headline commodity, remains under stress.
Chart 2: US cracking spreads still climbing
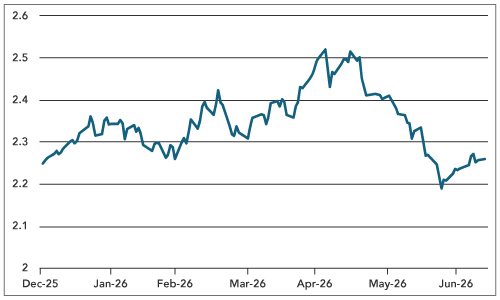
Inflation expectations and long-term bond yields. US 10-year breakeven inflation rates have moved to around 2.3%, from roughly 2.1% before the conflict escalated having touched 2.5%. European equivalents are trending in the same direction. Long-end bond yields have remained surprisingly contained — which either reflects confidence that central banks will act, or a market that hasn’t fully priced the inflation risk embedded in the product and freight data. That divergence is worth watching.
Chart 3: US 10-year break-even widens but still well below May peak
Source: Bloomberg
Taken together, these indicators tell a consistent story: the Strait hasn’t closed, but the cost of using it has risen sharply, and the buffer in refined-product markets that might absorb a further shock is thin. The next phase of this crisis may be less visible on television and more visible in freight invoices, refinery margins and corporate earnings guidance — particularly for manufacturers and logistics companies with thin margins and limited pricing power.
The Global Economy Has Been Resilient — But That Resilience Has Limits
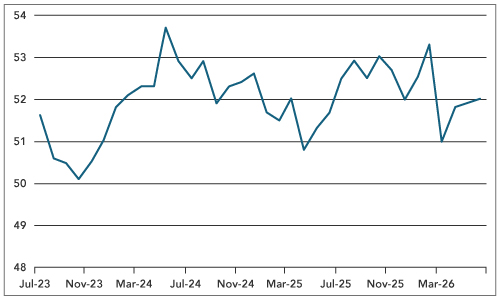
Global demand has held up better than most expected. The June global composite PMI sat at 52, consistent with above-trend growth. US consumer spending came in stronger than expected. Western Europe is showing tentative signs of industrial recovery — German factory orders have strengthened, construction may be turning, and automobile registrations have risen. Japan is growing above its long-term potential on stronger wages. Even parts of emerging Asia have sustained reasonable momentum despite pressure on energy import bills.
Chart 4: Global PMI recovering
Source: Bloomberg, JPMorgan
China is the principal exception. Growth looks set to slow sharply after a strong first quarter, with exports and industrial production carrying most of the load while household consumption and property investment remain subdued. An economy that relies this heavily on external demand is unusually exposed to any disruption in trade routes or the global goods cycle.
Households across most major economies have absorbed years of consecutive shocks and spending has proved more durable than confidence surveys suggested. Employment holding firm explains part of that. Households running down savings explains the rest — and that’s worth watching carefully. The US personal saving rate is forecast to average just 3.1% through 2026, declining further towards 2.6% in 2027. You can smooth shocks by drawing down savings, but not indefinitely. Governments face a similar constraint, many are already running substantial fiscal deficits, limiting the space to absorb another energy shock the way some did in 2022.
Global equipment investment — driven heavily by AI and technology infrastructure — is expected to rise more than 10% this year and remains a genuine tailwind. But the broader point stands: the global economy hasn’t escaped the shocks; it has absorbed them. Those are different things.
Three Assumptions Markets Are Currently Making
The calm in global equities implies investors believe the conflict will remain economically contained, even if not militarily contained. Markets have learnt — perhaps too well — that geopolitical spikes tend to fade. The 2019 Abqaiq attack disrupted roughly half of Saudi production; prices quickly fell back when supply was restored faster than expected.
The risk is confusing past reversibility with permanent resilience. Hormuz is not an oil installation. It’s a transport artery with no seamless replacement. Pipelines bypass part of the route, strategic reserves provide temporary support, other producers can increase output at the margin, but none of that fully substitutes for the Strait, particularly for Asia’s energy-importing economies.
Markets are currently making three specific assumptions:
1. Iran does not sustain a complete closure
2. The US can protect or restore commercial navigation
3. Energy infrastructure stays largely outside the direct conflict
A failure of any one would push oil, shipping costs and inflation expectations materially higher. A failure of all three creates a fundamentally different economic picture — and the most exposed economies are not necessarily in the West.
The second assumption — that the US can protect commercial navigation — deserves particular scrutiny. Sustained strike campaigns draw down munitions stockpiles that were already under pressure after prolonged support for Ukraine. Military readiness is not an unlimited resource any more than household savings are.
Earnings Season Is the Reality Check
Only 18 S&P 500 members reported last week, but 85% beat estimates — a strong opening on too small a sample to mean much. The major US banks now begin reporting: JPMorgan, Goldman Sachs, Wells Fargo, Citigroup, Bank of America and Morgan Stanley. Their results are among the most whole economy informative data points of any quarter. Management commentary will tell us whether consumers are still spending, delinquencies are rising, companies are borrowing, and whether provisions for bad debts need increasing. The more important signal comes from loan demand and credit quality — and from any commentary on international business lines where the Gulf situation is most directly felt.
Semiconductors may matter even more for market direction. ASML and TSMC both report this week. ASML’s order book reflects chipmaker confidence in committing to future capacity. TSMC — underpinning much of the global technology supply chain — reveals the strength of advanced-chip demand and whether supply remains constrained. The AI infrastructure buildout is a global capital cycle drawing in equipment, materials and energy from across Asia and Europe. The question has shifted from whether AI spending is large to whether returns will be sufficient — and fast enough — to justify current valuations from New York to Tokyo to Amsterdam.
Inflation Data Will Look Backward While Markets Look Forward
US CPI for June publishes Tuesday. Headline prices are expected to fall month-on-month as fuel prices reverse, while core inflation rises modestly — leaving underlying inflation well above the Fed’s target and reflecting a world that has already moved on. June inflation fell because petrol prices dropped. July inflation could rise because the Gulf has intensified. Services inflation remains stubborn across most developed economies, and surveys of shipping costs, supplier delivery times and manufacturing prices suggest pipeline pressure hasn’t gone away.
Fed Chair Kevin Warsh presents his first semi-annual monetary policy testimony to Congress on Tuesday. His framing of whether higher energy prices constitute a temporary supply shock or a genuine inflation threat will be watched not just in Washington but in London, Frankfurt and Tokyo, where central banks face versions of the same dilemma. The Fed minutes suggest unusual internal division — one group expecting rates to rise through 2026-27, another favouring cuts. Warsh’s testimony may reveal as much about managing a divided committee as it does about the next policy move. The ECB and Bank of England face related pressures, navigating stubborn services inflation against slowing goods demand. Another energy shock, arriving before the 2022 one has been fully absorbed, complicates all of their paths.
What Would Change the Market’s Mind
More strikes alone won’t break the market. The picture changes if vessel traffic through Hormuz falls substantially and stays low; if maritime insurers withdraw cover; if diesel and jet-fuel prices accelerate far ahead of crude; if inflation expectations shift sharply higher; if bank executives report deteriorating credit; or if semiconductor companies signal a pause in AI capital commitments.
Until then, markets will likely continue climbing an uncomfortable wall of worry. Corporate balance sheets are generally strong, labour markets broadly supportive, and the global economy has repeatedly demonstrated a capacity to absorb and reroute around shocks.
But the margin of safety is narrowing. Household saving is low, government debt is high, and underlying inflation was already uncomfortable before this latest escalation. The economies most exposed to a genuine Hormuz disruption — energy-importing Asia in particular — have less buffer than in previous cycles.
The war oscillates between diplomatic language and military action. Forecasting each turn adds little investment value. The discipline worth maintaining is simpler: monitor how war becomes economics.
Follow the ships. Follow the refineries. Follow the fuel prices. Follow the earnings.