
Jun 3, 2026
Global markets entered May still balancing two powerful forces: resilient equity earnings and a deteriorating macro backdrop. Growth data have become more uneven. The economic surprise data show a striking divergence: the United States and Japan have recovered sharply, while Europe has fallen deeply into negative territory. That matters because markets are no longer dealing with a simple global slowdown. They are dealing with regional divergence, with the US and Japan still producing positive data surprises and Europe increasingly looking like the weak link.
Chart 1: Regional Economic surprise Indices – marked weakness in Europe
Index
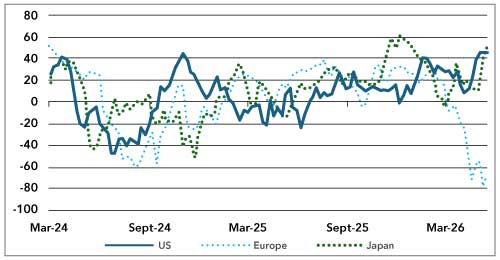
Source: Bloomberg
Markets have been waiting for clearer evidence of how higher oil prices are feeding into the global economy.. A sharp rise in oil prices was never going to show immediately in goods prices. Think of it this way. The oil that is being used today was probably shipped from the Gulf in early February. The shock of March/April, however, is probably now only a matter of a few weeks away from having a more meaningful impact.
The inflation story will likely become more uncomfortable. The Gulf shock is no longer just an oil-price story. It is moving through shipping, insurance, fertiliser, metals, fuel and physical inventories. Recent GCIO weekly work highlighted the risk that the inflation shock becomes a supply-chain sequence rather than a single commodity spike: freight delays, higher insurance costs, replacement sourcing, inventory drawdowns and eventual margin pressure or pass-through to consumers. That is a harder problem for central banks because cutting rates into a supply shock risks validating higher inflation expectations.
Chart 2: Global Growth and Inflation Surprise Indices sit close to Zero
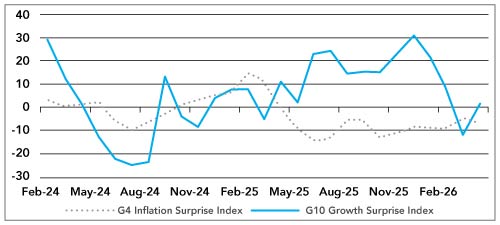
Source: Bloomberg
Central banks are therefore decisively moving away from the comfortable easing narrative that markets had hoped for earlier in the year. Even Kevin Warsh, often seen as sympathetic to the US President, has suggested that higher Fed funds rates may be needed early in a future Fed chairmanship. The US yield curve tells the story. The US 10-year yield is back around the mid-4% area, while the 2-year yield is closer to 4%. The curve has not returned to a clean recession signal. Instead, the long end continues to carry a visible inflation and fiscal-risk premium, while the front end remains constrained by the Fed’s reluctance to ease. That is why bonds have not provided the portfolio protection investors would normally expect in a growth scare.
The war and the disruption around Hormuz remain the key macro swing factor. Our weekly work has argued that markets are pricing a hope that physical supply conditions normalise, rather than a high-confidence probability. Oil around current levels is consistent with managed stress, but not with a prolonged stand-off in which inventories continue to fall and shipping routes remain impaired. The uncomfortable scenario is not necessarily dramatic escalation. It is a stand-off that goes on long enough to feed into core prices, wages, inflation expectations and currencies. Shipping through the Strait of Hormuz has still not normalised.
For portfolios, the message is uncomfortable but clear. Duration is not yet a dependable hedge, equities remain narrow in leadership, and commodities are again behaving as both inflation insurance and strategic assets. Investors may need more real-asset exposure, more regional selectivity and less faith that central banks will quickly rescue markets.
Asset Markets
Chart 3: Asset Market Returns (% USD TR)
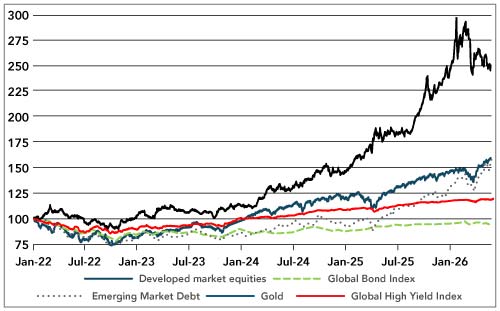
Source: Bloomberg
Global Equities
Global equities had a strong month, led by the US, NASDAQ, Asia ex Japan and emerging markets. The global index rose solidly, but the better story remains regional dispersion. The US market continues to be supported by large-cap technology and AI-related earnings. NASDAQ materially outperformed the broader US market, which again tells us that investors are still willing to pay for companies tied to AI infrastructure, cloud demand and semiconductor capacity.
Emerging markets were the strongest major regional grouping. Asia ex Japan was also very strong, helped by the AI hardware cycle, semiconductor supply chains and the continued recovery in parts of North Asia. The Korean market has been one of the most powerful expressions of this theme. The move is not just a general emerging market rally. It is a concentrated bet on memory, high-bandwidth chips, AI servers and the companies that sit close to the physical infrastructure of the AI boom.
Chart 4: MSCI Emerging Markets relative to MSCI World Developed
rebased to May 2025= 100

Source: Bloomberg
Japan also performed well. The market continues to benefit from corporate reform, domestic reflation and foreign investor interest. However, the equity story is now increasingly linked to the yen and the bond market. A weaker yen supports exporters, but it also imports inflation through energy and food. That puts the Bank of Japan in a more difficult position and raises the risk that higher domestic yields eventually become a headwind for equities.
Europe lagged the US and Asia. The region still offers valuation support, but the macro data are weak and the economic surprise chart is not encouraging. Europe is more exposed to energy-price pressure, weaker consumer demand and the risk that the ECB is forced to stay tighter than growth alone would justify. UK equities were only modestly positive, helped by their defensive and commodity-linked bias, but the UK’s broader macro mix remains difficult.
India and China both underperformed. India remains structurally attractive, but the market is still digesting valuation excess and the rupee has come under pressure. Higher oil prices are a direct tax on India through the import bill, inflation and the current account. China remains a selective opportunity rather than a broad domestic demand recovery trade. Policy support is visible, but investors still need evidence that domestic confidence and private-sector activity are improving.
Brazil was the clear weak spot in the table. That is notable because commodity exposure would normally help in this environment. The weakness suggests country-specific risk, positioning and currency dynamics overwhelmed the broader commodity support during the month.
Table 1: Equity Market returns to end May ’26
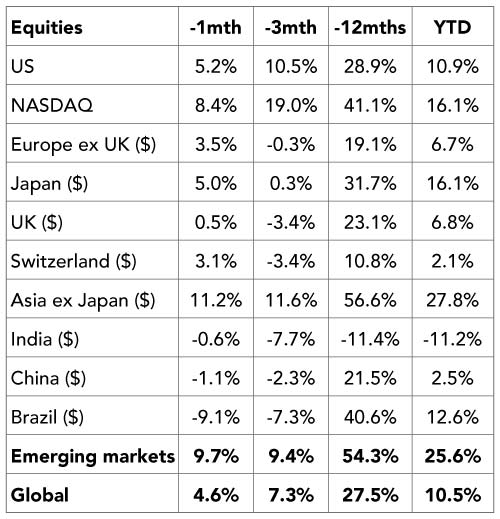
Source: Bloomberg
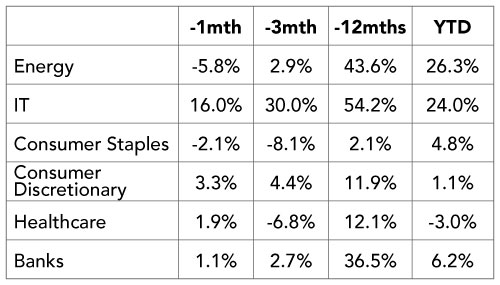
Equity sector performance
The sector picture was very clear. Information technology was the dominant winner. A monthly gain of 16% stands well above the other sectors in the table and reinforces the point that the AI trade is still driving global equity leadership. The market is not treating AI as a normal technology cycle. It is treating it as an infrastructure race. That keeps capital flowing into semiconductors, cloud, data centres, power equipment, cooling systems and the wider hardware supply chain.
But this was not a MAG 7 moment, indeed if you rank the performance of all the MAG 7 stocks the top performer Apple was ranked 77th with a ‘paltry’ 15% return!
Table 2: MAG 7 – Eat Your Heart Out – Top Performing stocks in the S&P500 in May
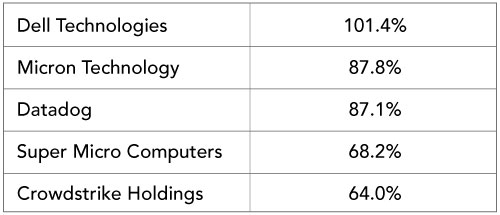
Source: Bloomberg
Energy was weak during the month, but that should not be misread as a broken investment case. The sector remains one of the strongest performers year-to-date and over 12 months. The monthly fall looks more like consolidation after a strong run than a collapse in the theme. Energy remains supported by war risk, disrupted shipping routes, tight inventories and higher strategic value attached to LNG, refining, fuel logistics and power generation.
Banks were positive but not spectacular. Higher-for-longer rates support margins, but the market is also starting to think harder about the credit cycle. Banks benefit from nominal growth and steeper curves, but they are not immune to slower activity, weaker consumers and higher defaults. The sector still has value, but the easy part of the margin expansion story may be behind us.
Consumer discretionary outperformed staples in the month. That suggests investors were still prepared to buy risk and cyclical exposure, particularly where companies have pricing power or exposure to wealthier consumers. Consumer staples were weak, which is worth noting. Staples are often treated as an inflation hedge, but they can struggle when input costs rise faster than companies can pass them on.
Healthcare was modestly positive but remains negative year-to-date. The sector has defensive qualities, but it has not yet been treated as the preferred refuge. In a market still led by AI and nominal-growth beneficiaries, healthcare continues to look more like a stock-selection sector than a broad asset-allocation call.
Table 3: Global Equity Sector Returns to End May ’26
Source: Bloomberg
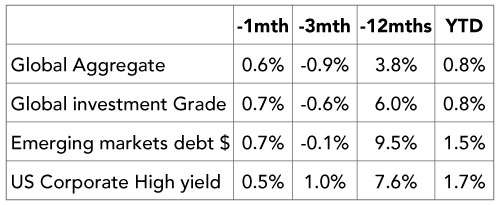
Bond markets
Bond markets delivered small positive returns, but the performance was not strong enough to offset the risk taken elsewhere. Global aggregate bonds and global investment grade credit both rose modestly. Emerging market debt and US corporate high yield also produced positive returns. The pattern tells us that investors still want income, but they are not yet convinced that duration is a clean hedge against global economic conditions.
The central-bank backdrop has become less supportive. The easing narrative is being retired. Our recent weekly work noted that central banks are now facing a more awkward mix of weak confidence, higher energy prices and persistent inflation risk. That is especially important for the Federal Reserve. Markets had expected rate cuts. They are now having to contemplate the possibility that the next move may not be down if inflation expectations shift higher.
The US yield curve is central to the story. The 10-year yield has moved back towards the mid-4% area, while the 2-year yield is modestly lower than the long end. That flattening is not a bullish signal. It is increasing market concerns about the risk of stagflation. Were it not for the pulse of technology capex we might be looking at a much flatter yield curve with recession-like conditions in the United States. For now, the US holds onto growth very narrowly focused on the tech sector.
Chart 5: US Yield Curve Flattens as US 2-year yield rises

Source: Bloomberg
Credit remains supported by yield premium, but the margin of safety is thinner. High yield performed better than government bonds, which implies markets are still not yet pricing a serious default cycle. That may be reasonable if growth remains resilient. It is less comfortable if higher energy prices and higher financing costs begin to squeeze lower-quality borrowers. Private credit stress is also worth watching, with our weekly analysis noting that US private credit default rates have continued to edge higher.
Emerging market debt was steady. The asset class benefits from high yields and, in some cases, stronger external balances. However, the backdrop is not uniformly supportive. Energy importers remain vulnerable, while commodity exporters are better placed. Currency differentiation will matter more than benchmark exposure.
Table 4: Bond Market Returns to End May ’26
Source: Bloomberg
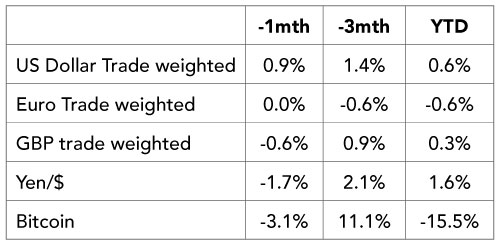
FX
The dollar rose during the month. That fits the macro backdrop. In periods of war risk, higher US yields and uncertain global growth, investors still run first towards dollar liquidity. The dollar is not without structural problems, particularly around fiscal deficits and reserve diversification, but tactically it still benefits from liquidity preference and interest-rate support.
The euro was broadly flat on the month. That is a reasonable outcome given the weak European growth data. The currency is being supported by the fact that the ECB cannot easily turn dovish while energy-driven inflation pressure remains visible. The euro is therefore caught between poor growth and less policy relief.
Chart 6: Euro/USD

Source: Bloomberg
Sterling weakened. The UK remains exposed to a difficult mix of higher inflation, weak real incomes, heavy fiscal pressure and a bond market that demands a risk premium. Gilt yields around 5% are not just a rates story. They are also a signal that investors require compensation for political and fiscal uncertainty.
The yen weakened against the dollar. That is a warning sign. Japan’s equity market can benefit from yen weakness, but the macro economy does not get a free lunch. A weaker yen raises imported inflation, especially in energy and food. That puts pressure on the Bank of Japan to normalise policy even as growth remains uneven.
The Australian dollar was firmer, helped by the stronger commodity backdrop and better risk appetite in parts of Asia. The currency remains a liquid proxy for the commodity cycle, China sentiment and global risk appetite. It is not yet a pure carry story. It is more a judgement on whether investors believe the real-asset cycle still has momentum.
The Indian rupee remains under pressure, although through May it managed to move back from worst levels. However, it was at the political cost of the Modi government introducing policies to dampen gold purchases. India’s problem is clear: higher oil prices feed directly into the import bill, inflation expectations and external balances. The equity market can still be structurally attractive, but currency pressure complicates the near-term case.
Bitcoin also fell and remains sharply negative year-to-date. It continues to trade more like a high-beta liquidity asset than a reliable hedge against geopolitical stress.
Chart 7: INR/USD back from worst levels but a cost of unpopular policies

Source: Bloomberg
Table 5: Currencies – to end May ‘26
Source: Bloomberg
Commodities
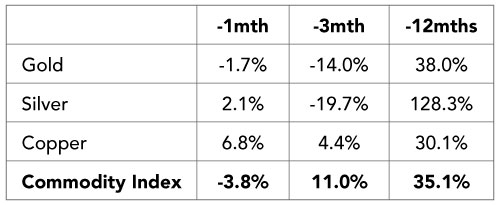
Gold fell during the month but remains strongly positive year-to-date and over 12 months. That looks like consolidation rather than a failure of the thesis. Dollar strength also worked against gold during the month, as higher US yields and renewed demand for dollar liquidity reduced the immediate appeal of holding a non-yielding asset. Physical demand was further disrupted by policy intervention in Asia, with India lifting import duties on gold and silver from 6% to 15% and Malaysia applying a 10% duty to some gold bar shipments, adding friction to bullion flows at a time when prices were already testing consumers’ tolerance.
Copper rose 6.8% in May, reinforcing its role as the bellwether commodity of the energy transition rather than simply a proxy for global manufacturing. The gain came despite mixed industrial data, suggesting investors are increasingly focused on structural supply tightness and the demand implications of electrification, grid investment, data-centre build-out and defence spending. In market terms, copper continues to sit at the intersection of the “old” and “new” economy: a 19th-century industrial metal now being repriced for 21st-century infrastructure.
The broader commodity index fell 3.8%, reminding investors that the commodity complex is not moving as one block. Copper is being priced as a structural scarcity asset, gold is consolidating after a major run, while energy markets remain caught between geopolitical risk and concerns that higher prices will eventually damage demand
Table 6: Performance of Commodities to end May ’26
Source: Bloomberg
Bottom line:
May was a month in which markets rewarded growth scarcity and physical scarcity at the same time. Technology led equities, copper confirmed the infrastructure theme, and bonds continued to offer only limited protection against the combined risk of inflation, fiscal pressure and geopolitical disruption. The main question for June is whether markets can keep treating the Gulf shock as manageable stress, rather than the start of a broader inflation and supply-chain problem.
