
May 6, 2026
Summary in plain terms: Stock markets are near all-time highs, but the economic backdrop is quietly getting worse — growth is slowing while inflation is about to become significantly more persistent. We think investors should tactically own technology and energy stocks, avoid longer dated government bonds, and prepare for a world where inflation will prove much harder to tame than markets currently expect.
The overarching theme this week is simple: economic growth is slowing down even before inflation has fully laid bare its tentacles. That chronology matters. The data that tracks how often economic numbers surprise to the upside has turned negative on growth, even as inflation surprises begin to unnerve all and sundry. Markets, meanwhile, are holding up because company earnings are strong, spending on AI infrastructure continues to accelerate, and the Fed chair’s decision to stay on at the central bank board removes one source of uncertainty. But the underlying economic picture is worse than the recent performance of stock markets would suggest — and the inflation story has a real-world, physical dimension that financial markets are still not fully pricing in.
The Fed – Nuanced
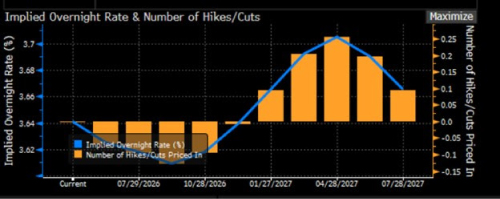
Jerome Powell deciding to remain on the Federal Reserve Board even as the chairmanship changes hands reduces one key overhang: the risk of a sharp, unpredictable shift in how the US manages interest rates. That is the positive read. The negative is that it also means there is no near-term pivot toward lower rates. The Fed is still dealing with inflation that remains above its 2% target, a jobs market that has not weakened, oil prices that remain elevated, and the cost of tariffs that are now visibly feeding through into prices. The ISM manufacturing survey made that abundantly clear. The headline index held in expansion territory at 52.7 in April (anything above 50 signals growth), but the prices-paid component, which measures what factories are paying for inputs, moved to a four-year high. The market wants the Fed to ease, but the data is not cooperating. And, in our view, it is going to get worse before it gets better.
Chart 1: Global Economic Surprise Indices – Inflation and Growth
Source: Bloomberg
GDP: Real but Narrow
The US economy grew at a 2.0% annualised rate (ar) in the first quarter of 2026. AI-related business investment and a rebound in government spending did most of the lifting. Consumer spending slowed to a 1.6% ar in the quarter. The household savings rate fell to 3.6%, the lowest in three-and-a-half years, meaning people are saving less and spending more to maintain their standard of living.
Business investment in computers and related equipment was up an impressive 64% compared with the same quarter a year earlier, and broader non-residential investment rose 10.4% over the same period. That contributed 1.4 percentage points to the quarterly annualised growth figure. AI spending and government outlays effectively accounted for all of the quarter’s growth. That is a real boom but it is not a broad one.
The importance of that concentration cannot be overstated. AI infrastructure has moved beyond being a stock market theme, and it is now propping up the overall growth numbers. The four major tech companies building out AI are on track to spend close to $700 billion on AI-related infrastructure this year. However, it also means the economy is now unusually dependent on this one cycle continuing. If AI spending pauses, slows, or disappoints on the returns it generates, the overall growth picture will deteriorate rapidly.
The US Consumer – stretched
Household spending is still growing but it is being funded with reduced financial buffer. A savings rate of 3.6% is not ideal – or, rather uncomfortable – when fuel costs are rising, tariffs are pushing up the price of everyday goods, and consumer confidence is weak. Retail inventories — the stock of goods sitting in warehouses before they reach stores — came in above expectations. On paper, that can look like strength, but in the current environment, it more likely means businesses pulled goods forward ahead of tariff-related supply disruption. If shoppers pull back on purchases, those inventories become a problem rather than a cushion.
Europe: The Same Problem, Less Cushion
Europe deserves a detailed analysis because of the prevailing dynamic there, which, if anything, is more uncomfortable than the US. Growth across the eurozone remains weak. Germany — the bloc’s largest economy — has barely avoided consecutive quarters of contraction. Industrial output is stagnant and consumer demand remains subdued. The European Central Bank has been cutting rates to support growth, but inflation has been a bit of a spoiler. Services inflation remain sticky, energy costs are feeding back into what businesses pay for inputs, and the same fertiliser and food cost pressures building globally are showing up in European producer prices — what factories charge before goods reach the consumer.
The result is a central bank caught between an economy that needs cheaper borrowing costs and a price level that does not justify them. What complicates the problem for Europe is it has less room to stimulate through government spending than the US, no equivalent AI capex boom that can act as a growth stabiliser, and its significantly higher exposure to energy supply disruption given how dependent the continent is on imported energy. If the Strait stays closed and physical oil prices remain elevated, Europe faces a harder version of the same trap — sluggish demand with supply-driven inflation that rate policy cannot easily fix without making growth worse.
Earnings – Tech Dependent
US company results for the first quarter have been strong. With more than 60% of S&P 500 companies having already reported, earnings growth is running at around 15.1% compared with a year earlier. Profit margins are at 13.4%, the highest level in data going back to 2009. More than 80% of the companies have beaten both earnings and revenue expectations. Among the large tech names, Microsoft, Alphabet, Amazon, and Apple all reinforced the AI and cloud spending story. Meta was the exception — it guided to higher spending alongside signs of softness in user growth.
Nevertheless, the strong earnings season is why stock markets have held near record highs, even as oil prices remain elevated and geopolitical risks continue to unravel. But expectations have now fully priced in the good news. Consensus forecasts are effectively assuming that margins will stay near record levels and that AI spending will continue to broaden. The historical parallel is worth keeping in mind: very strong earnings growth is typically a positive signal after a recession, when profits are recovering from a low base. Outside that setup, strong earnings and confident forecasts have often appeared close to market peaks. The comparisons — 1929, 1973, 2000, 2007 — are not a prediction of a crash. They are a reminder that markets become more fragile when margins are already stretched and analysts are raising forecasts into a deteriorating backdrop.
Chart 2: Consensus Expectations for US Corporate Profits Growth vs. History

Source: Bloomberg
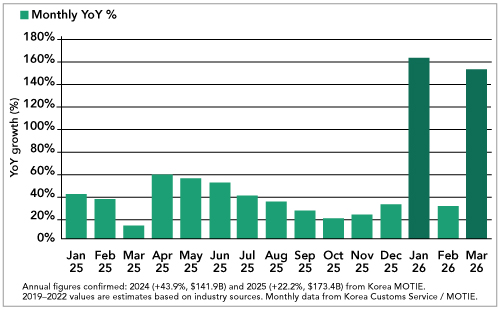
Korea: A Clear Read on the AI Cycle
Korea is worth highlighting because its exports figures provide one of the clearest global readings on where the AI cycle sits. Exports rose 48% in April compared with a year ago. Semiconductor exports were up 173% year on year; computer-related exports were up a staggering 516% year on year. The AI cycle is generating extraordinary demand, and it is genuinely global.
But Korea also shows how narrow the overall dynamic is. Car exports fell 5.5% year on year. Middle East exports dropped. Import costs rose 16.7%, partly because crude oil prices are pushing up the energy bill. Semiconductors are strong enough to flatter the headline numbers, but they are not strong enough to offset weak domestic demand or protect the economy from energy-driven cost inflation. It is the same story as the US, just viewed through a more export-dependent economy.
Chart 3: Year-on-year Growth of S.Korea Exports of Semi-conductors
Source: Bloomberg
The Inflation Problem is Physical, Not Just Statistical
Here is what markets are still not fully pricing. The Strait of Hormuz remains closed. In the futures market, Brent crude is trading around $90 to $95 a barrel. In the physical market, where actual cargoes are bought and sold today, the price is closer to $150. That gap will not persist indefinitely. When it closes, the inflation already showing up in factory surveys will look like an early warning, not the main event.
On top of that, prices of fertilisers such as nitrogen, potash, and phosphate that underpin global food production, are up substantially. This does not feed into consumer prices immediately. It works through over three to six months, as higher input costs reach farm gates, then supermarket shelves. By the time it is visible in official inflation data, it is already embedded. Central banks can raise interest rates to cool demand. They cannot create food supply.
So, the straightforward question to ask is: given the Strait is closed, given physical oil is trading at a level consistent with a sustained supply shock, and given agricultural input costs are rising sharply, what is the honest base case for inflation? It is not lower. A more defensible view is that inflation data over the next two to three quarters will come in above what markets currently expect. The Fed is effectively implying this by keeping rates on hold. The bond market has not fully priced it yet.
When it does, the yield on 10-year US government bonds will move higher. Rising long-term yields amid slowing growth and expensive equity markets exert real pressure on stock prices. Maybe that is not the trade for today, but it is the trade that is building.
The Path Forward
For now, the path of least resistance in equity markets appears to be upward. Technology and AI infrastructure remain the right place to be. The investment cycle is real, earnings are delivering, and AI spending is now embedded in US growth. Energy is the logical companion trade: if physical oil is closer to $150 than the futures price implies, energy company earnings are being underestimated at this juncture and the sector provides a direct hedge against the inflation risk that everyone else is underpricing.
What to avoid is owning long-dated government bonds. The bond market is still pricing in the ideal scenario – a world where inflation fades and central banks cut rates. Every week, the Strait stays closed and every prices-paid print that moves higher makes that world harder to justify. If the inflation data this summer surprises to the upside — and the physical commodity inputs give strong reason to think it will — 10-year yields will push higher, and the valuation support for expensive, long-duration equities will erode with them. Companies with high valuations built on future earnings will get hit the hardest. Companies generating strong earnings today, in energy and AI infrastructure, will not.
The positioning logic, stated plainly: own the things that benefit from the AI capex cycle and from energy inflation, keep away from long-duration bonds, and watch what factories are paying for inputs and where physical oil trades relative to what the futures price suggests. When those two signals align consistently, the window for equity markets to hold current levels will be narrowing.
