Jan 22, 2018
“The biggest mistake is being fearful of making a mistake” – anonymous
In a test, students are asked to identify players playing basketball in white shirts. In the midst of the video, a student dressed as a gorilla walks onto the court pounds his chest and walks off. At the end of the test, half the students never notice the gorilla. That’s the Illusion of Attention: we only see what we look for. We investors miss the gorilla all the time, and this week we discuss some ways to address the illusion of control.
Last week was eventful. Some data points have shifted:
The IEA Reports Explosive Growth in Shale Is Coming…
The IEA reports that the U.S. is already the top producer of natural gas in the world and will become the top producer of oil this year. Explosive growth in Shale is coming, and increased production out of Brazil and Canada will offsets losses in Venezuela, Mexico and OPEC production cuts. China has been aggressively shifting to cleaner energy, importing substantially larger amounts of LNG. With this news, it’s unlikely crude will be breaking out to higher levels, great news for India.
The Domestic Yield Curve Is Not Signaling Any Concerns
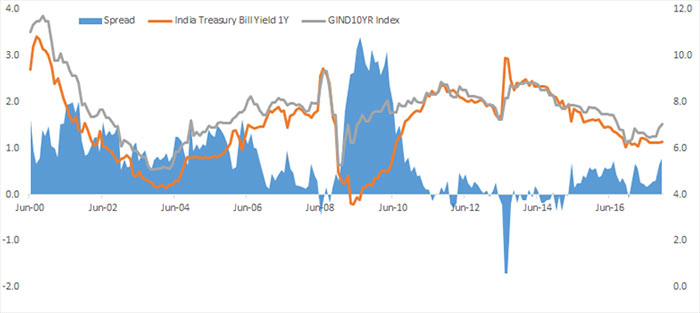
Rising short term yields presaged downturns in 2000, 2007, 2010 and 2013. Today’s short-term yields are essentially flat, suggesting there aren’t any pressures building in the economy. Further, the 10/1 spread is positively skewed and rising. Inversion in 2000, 2007, 2011 and the dismal years of 2012-13 were signalling that things were sluggish on the growth front. Today’s rising slope is driven up by fiscal deficit financing concerns, but the curve suggests that the economy remains healthy.
A Flat Sloping Short Term T-Bill Suggests No Overheating Pressures Anywhere to Be Seen…
A Rising Slope on the Yield Spread Suggests Conditions in the Economy Remain Healthy…
The Equity to Bond Yield Spread Is Close to a Sell Signal for Equities…
It is Important to Note It Was 9 Months Too Early in 2014…
… On the Other Hand, Bonds Are Starting to Look Attractive
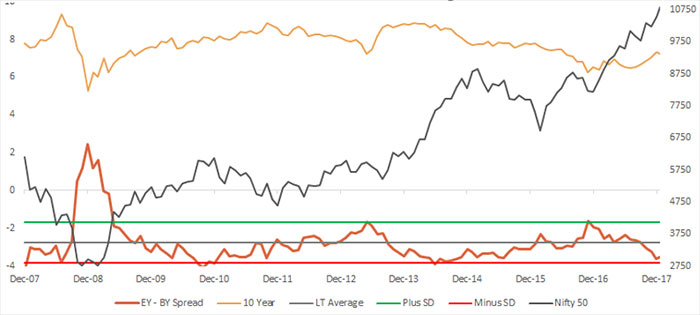
The Equity Bond Yield Spread Is Approaching a Sell for Equities, But it is Often Times Early…
We’ll start by pointing out that this signal was 9 months early in 2014 to the eventual top in the market, so it’s not perfect. Equities continued to rise dramatically during that time. The signal’s got a better record on bonds, and it’s close to a buy signal.
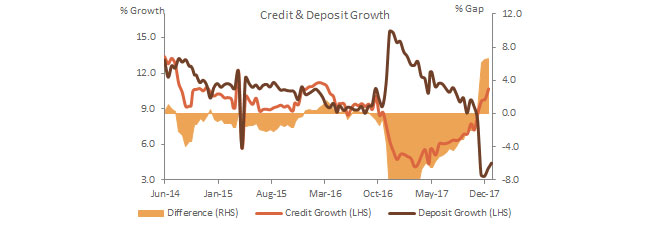
An Added Positive Economic Data Point… Non-Food Credit Growth Hits 10.6%
Non-food bank credit grew 10.6% in the week ended 22-Dec-17. In contrast, deposit growth came in at a mediocre 4%. While bank credit is a positive, the lacklustre deposit growth is worrisome, driven by unappealingly low interest rates and a rotation of funds to equities.
Non-Food Credit Growth Is at 10.6%… …Adding Further Confirmation to the Thesis that the Economy Is Recovering … While Deposit Growth Came in at a Dismal 4.0%
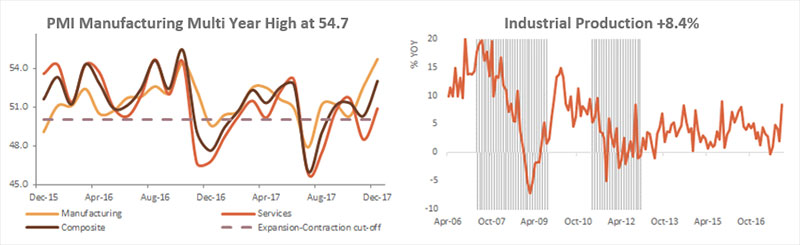
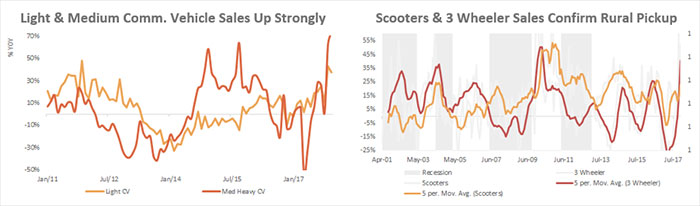
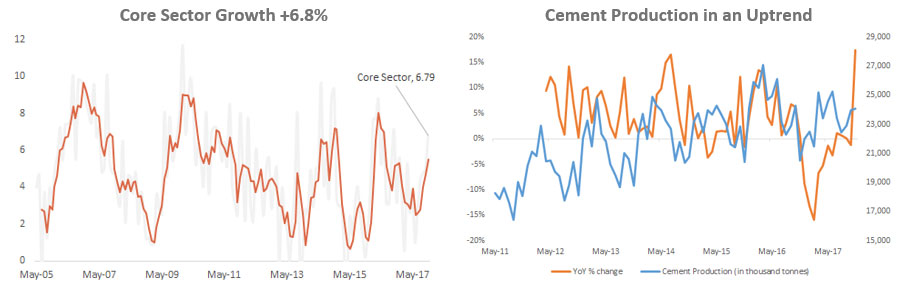
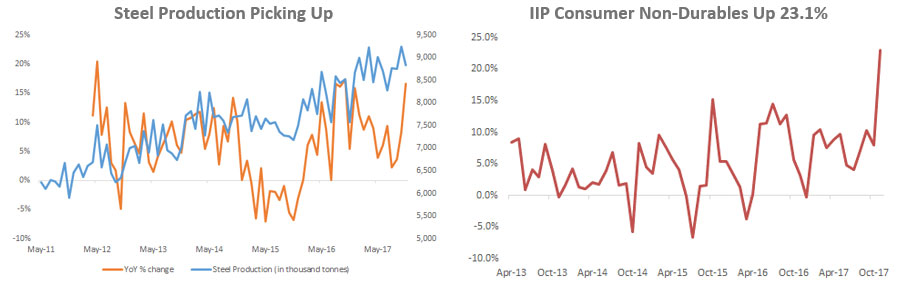
A Slew of Indicators Suggest that the Economy Is Recovering…
Investment Outlook
The global economic backdrop is strong, as is the domestic economy. Domestic earnings look promising and crude is likely to be range bound. The Indian economy is starting to show the signs of an economic pickup, and we’re late to the party relative to developed markets, delayed by demonetization and GST reforms. Private banks and consumption stocks have delivered good numbers.
Second, let’s acknowledge the risks. The valuation on the Nifty is currently 27.4x trailing and higher on midcaps. The dramatic rise to 10,900 has pushed valuations to nose bleed levels. The second risk is that the spread differential on bonds versus equities is close to a sell signal on equities, but historically early. The Fed is hiking rates and withdrawing liquidity. Domestic Inflation remains a concern, but under control globally.
Third, the market’s technicals deteriorated this past week. Now whether this gets washed away by flows remains to be seen, but buying volume has dissipated, breadth has worsened, and mid and small caps were sold last week, with a rotation to large caps.
Let’s recognize that flows remain strong, with FIs pumping in 8,600 crores in Jan and domestic buyers continuing to buy in a trend that does not show signs of abating. With woeful returns in debt, more savers are moving money into equities. Today’s sentiment makes it reasonably certain that a 5% or 10% correction is likely to be bought.
There will be corrections along the way. Risk averse investors would do well to carefully review their asset allocations, rebalance accordingly and consider tactical and protective strategies. Successfully navigate these corrections, and the returns will be stellar. Prudently manage these corrections, via protection, or by accepting them without losing control over your emotions, and the returns are impressive and acceptable. The difference between investing in debt and equities since 2010 is stark. Debt has returned on average around 8%, while good equity funds and managers have generated long term returns of 18% plus.
Finally, basing investment decisions on index levels and valuations is a sub-optimal strategy. The dispersion on performance is likely to widen as we move forward. Attractive investments at reasonable valuations continue to come forward regularly. Competent fund managers have delivered returns far in excess of the benchmark, and will continue to do so.
Asset Allocation & Portfolio Strategy
The path ahead starts with a review of investment policy, a review of strategic and actual allocations, and stated levels of risk tolerance. For instance, an equity exposure of 100% does not work if the stated risk tolerance is a maximum 10% downside.
One elegantly simple strategy is to identify upcoming liabilities over the next 5 years, and set aside funds to match these liabilities. The remaining portfolio should then be invested for growth, in high yielding asset classes. An asset allocation mix, and appropriate debt exposure, can then be selected on risk tolerance using our wealth profiles as templates.
Equities
Review Your Investment Managers. Today, we think size is starting to become inversely proportional to return. Eschew fund managers that haven’t been disciplined on restricting incoming investor flows and fund size. Abandon closet indexers. Pick managers that understand the business cycle and demonstrate an intent for absolute return.
Consider Principal Protection and Tactical Strategies. Principal protected strategies can provide peace of mind and lock in hard earned gains over the past few years. Fund managers that deploy tactical protection can generate strong alpha and are preferable over closet indexers, or benchmark driven funds.
Fixed Income
Around a year back, around demonetization, we went neutral on interest rates. Today, the rise in interest rates looks to be on its last legs, and our opinion is buoyed by indications that the government is likely to maintain fiscal discipline. We were of the view last year that many investors were complacent in expecting double digit returns in fixed income, and would be surprised with disappointing returns. In the event, that’s turned out to be the case.
With the government’s moves on opening up FDI, a similar strategy to open up the fixed income investment limits for FIIs would be a welcome move, one that could lead to an immediate decline in G-Sec and corporate rates. Concerns around the exchange rate can be managed effectively by the RBI.
For conservative investors, short term debt appears to be the safest bet. For moderate and aggressive investors, some duration is likely to make sense in coming days, post budget clarity. However, a three-year holding horizon makes it extremely difficult to make a duration call.
At an aggregate level, corporate credit spreads have narrowed, and the rising risks lower down the rating scale are not offset by a commensurate rise in returns. Corporate credit was the top performing sub sector last year, but the narrowing spread versus G-Secs leaves lesser opportunity on spread compression for fresh money. We’ll formalize our thoughts on debt post the budget.
Commercial, Student Housing, Affordable Housing and Private Transactions Are Attractive Alternatives for Diversification
It’s time investors evaluate alternative asset classes. Commercial real estate, student housing, and private transactions can offer substantially higher yields, with appreciation, no stringent holding period requirements and limited risk of low returns.
In Closing, the Key to Investing Successfully …
Investing successfully over a lifetime does not require a high IQ, exceptional market calls or inside information. The easiest way to address the illusion of attention is a sound intellectual framework for making decisions, patience, holding for the long term to let the benefits of compounding kick in, and most importantly, the ability to keep emotions from eroding that framework.
Technical Outlook
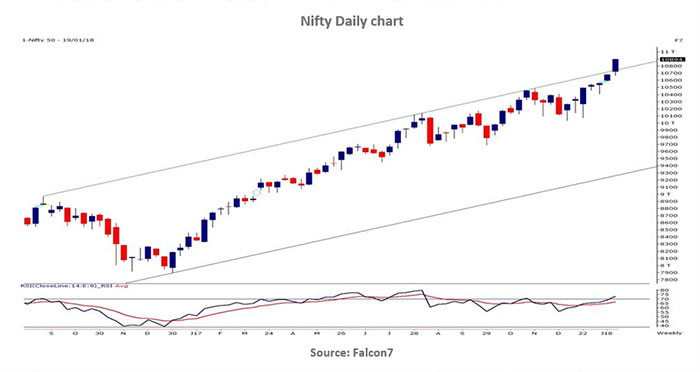
It was a good week for Nifty with two percent gain to close at new all-time high of 10895 levels almost at its high of 10906.85 hit in Fridays session. But broader markets were in for a bruising with BSE Mid and Small Cap index losing 2.1% and 2.7% respectively for the week.
Last week Nifty showed lot of strength as the new highs negated any bearish formation during the week. Looking at the below attached weekly chart, index has given breakout above rising resistance trendline which was acting as the supply point for the market. In Nifty options strike price 10800 and 10900 Puts have seen good amount of open interest additions suggesting support for the market is moving higher.
While Call options strike price 10800 to 111000 have seen unwinding of open interest suggesting higher levels opening up for the market. Now sustaining above 10780 levels, next target for index is seen at 11050 levels and then possibly 11125 levels. On the downside breaking below 10780 may see decline towards 10660 levels which was last week’s low. INDIA VIX continues to hover around 14 levels and a rise above 14.5 levels would be cause of concern for current rally.