
Jul 8, 2019
“Even the intelligent investor is likely to need considerable will power to keep from following the crowd.” – Benjamin Graham
PMS Quarterly Performance – Olympians Large Cap Portfolio
Olympians is Up +14.4% YTD, +6.3% QTD, and +17.5% CAGR Since Inception
Olympians delivered 14.4% YTD, 6.3% QTD return in the quarter ended June 30th, 2019, outperforming the benchmark NSE 100 by 7.5% and 5.5% respectively. Up years have seen returns of 29%, 38%, 21% while the worst down year is -1.6% in FY16. In a world where portfolio managers have routinely saddled their investors with large losses, Olympians meets investors objectives for high returns with a high 17.5% CAGR since inception, and a worst annual return of -1.6% in FY16.
Consistent High Returns with +17.5% CAGR Since Inception…
…Low Volatility: Worst 1 Year Return of -1.6% in FY 16

1 Crore Invested in Olympians in 2012 Is 3.2 Crores Today, a 227% Return…
…Versus 2.2 Crores in the Nifty 50, an outperformance of 105% over the Nifty 50

Absolute Outperformance of 105% Versus the Nifty 50
1 crore invested in Olympians in March 31, 2012 would have more than tripled in value to 3.27 crores, for a return of 227%, while 1 crore invested in the Nifty 50 would have grown to 2.22 crores. That’s a difference of 105% in just 7 years. Consistent outperformance adds up over time.
Relative Performance – Outperforming the Benchmark by 5.9% per annum Since Inception
Olympians has consistently outperformed the benchmark in all years except FY17, outperforming the benchmark by 5.9% annually since inception.
Consistency and Loss Avoidance – Worst Year Return Since FY13 is -1.6% in FY16
Olympians worst downside annual performance is -1.6%. Since FY13, there has been only one negative return year. From a quarterly perspective, only 2 of 30 quarters had returns below -1%, with negative returns of -5.9% and -13.8%, or only one double digit loss quarter. In comparison, 21 of 30 quarters or two thirds of the time, the fund delivered positive returns in excess of 3%.
2 of 30 Quarters with Negative Returns -5.9% and -13.85 Below -1% in 7 Years…
… 21 of 30 Quarters of Returns Above 3% (12% Annual Hurdle)

PMS Quarterly Performance – Titans Multi Cap Portfolio
Titans is Up +9.1% YTD, +5.0% QTD, and +15.2% CAGR Since Inception
Titans delivered 9.1% YTD, 5.0% QTD return in the quarter ended June 30th, 2019, outperforming the benchmark NSE 200 by 3.2% and 4.7% respectively. Up years have seen returns of 24.8%, 34.8%, 29.3% and 19.1% while the worst down year is -8.4% in FY16. Titans meets investors objectives for high returns with a high 15.2% CAGR since inception, which is depressed 2-3 percentage points due to muted small and mid cap performance.
Outperformance – Outperforming the Benchmark All Years except FY19 and 3.3% Annually Since Inception
Titans has outperformed the benchmark in all years except FY19. FY16 was essentially a flat year versus the benchmark. The underperformance of FY19 is due to the benchmark holding 88.5% large cap weighting, the carnage in mid and small caps, and Titans as a true multi cap holding 62% large cap weighting.
Titans: Low Volatility, High Returns, Poised to Accelerate on Mid & Small Cap Recovery

Titans Outperformance Has Accelerated Since Summer 2016

Performance Attribution
Asset Allocation – A Positive View on Macros Aided Portfolio Positioning
Our portfolio performance review starts with asset allocation. Both portfolios were aided by our non-consensus bullishness in late October, November and early January, (here, here, here) allowing us to position for return, not risk. Cash raised in early October was re-deployed by late October and November, leading to portfolios being fully deployed as the market rally ensued.
Capitalization… Tilt to Large and Quality Has Aided Performance
There has been much chatter about small and mid caps getting ready to outperform. While technical and price performance trends seem to suggest this is the case, we did not see confirmation during the quarter. Choosing to tilt towards quality growth, large caps and giant caps, aided portfolio performance measurably.
Mid and Small Caps Seem to Be Close to Bottom, Based on Historical Trends…
…But There’s No Evidence For a Reversal in Performance Yet

India’s Sector Leaders Continue to Dominate Returns…
…Notably, Autos and Pharma, Once High-Flyers are Now Amongst the Fallen

Sectoral Attribution
We loosely group sectors into Leaders, Resurgents, Fallen, One Act Wonders and Whipsaw Specialists. We’ve chosen to stick with the Leaders, adding to the Resurgent, and exiting the Fallen. We’ve also chosen to avoid the cyclicals. These decisions have contributed to outperformance.
Portfolio Stock Selection & Strategy
At the stock level, a couple of notable exits come to mind: Yes Bank in the 300s, now under 100, and Eicher Motors, above 29,000, now at 19,300. Eicher was a 4% weight in the portfolios and we protected 50% gains. These two trades by themselves enhanced returns by a few percentage points.
The Only Investing Asymmetry
All investors can be grouped into four buckets, as shown in the table below. Aggressive investors gain more when the market rises, and lose more as the market falls. Similarly, passive investors gain less and lose less. Therefore, the only skill that adds alpha to portfolios is the ability to gain more when the markets are in a propitious phase and lose less when markets are falling. This superior skill is the only investment asymmetry that we seek.
Superior Skill is the Only Investment Asymmetry

Turnover
Olympians calendar year to date turnover is less than 10%. Titans CYTD turnover is ~17%.
The Hardest Task for a Portfolio Manager
The hardest task for a portfolio manager is following an investment strategy that doesn’t work anymore. In that regard, Olympians and Titans are both strategies that follow a philosophy anchored to growth. It’s worked for decades and will continue to do so. Large cap strategies that banked on beta such as adding mid cap and small cap exposure to large cap funds are a strategy that stopped working last year.
Our Portfolios PEG Ratios Are 1.4 and 1.1 Times Respectively for Olympians and Titans…
…With Both Delivering 20% Earnings Growth…
…While the Nifty’s PEG is 2.2

Portfolio Expected Return is a Function of Price Paid and Future Earnings Growth
We strive to ensure that as valuations rise, our portfolio valuations remain anchored to reasonable levels. Expected FY 20 earnings growth for both Olympians and Titans is firmly in the 20% range. Titans has slightly higher top line growth, which is to be expected with its larger multi cap exposure. PE/G, or the PEG ratio is a ratio that compares the earnings growth with the P/E. A PE/G of 1 is preferred, the lower the better. Titans PE/G is 1.1 times, while Olympians is slightly more expensive, at 1.4 times. That’s a function of the large / multi mix. In contrast, the Nifty 50 is sports a fairly low run-rate earnings growth, while the P/E is easily twice the earnings number and a PEG ratio of 2 or higher
Final Thoughts – The Hardest Thing as an Investor
In Walter Isaacson’s book, Steve Jobs, Jobs offered 10% of the company to a man named Ron Wayne, an engineer. Wayne was a perpetual worrier and worried about a global financial meltdown in the late 1970s. He had misgivings about Apple and was worried creditors would come after him if Apple went under. He turned down the offer to be a partner, losing the opportunity to make $2.6 billion. He resides in a small home and lives off social security.
It will regularly, or at regular intervals, feel and seem like “world is coming to an end”. As P.M. Modi terms it, professional pessimists will have their say, and the hardest thing for an investor is to stay invested, keep investing and stay resolute and stick to their financial plan. Do this, accept risk, and attractive, meaningful returns are usually forthcoming.
Quarterly Market Performance
The Easiest Way to Beat the Nifty 50? …
…Own the BSE Sensex Index

One Key Index to Add to Portfolios Would be the Nasdaq Composite…
The Nasdaq Comp Has Consistently Edged the Nifty 50’s Returns and Is a Top Performer


Real Estate Was the Top Performing Sector During the Quarter and YTD…
…Real Estate’s 1.5% 5 Year CAGR Suggests Huge Catchup Opportunity…
…Pharma Stocks Took It on the Chin Alongside PSU and Autos

Shanghai Remains the Top Performing Index YTD…
…Most Emerging Markets Have Done Well YTD…
… India Dominates 3 Year and 5 Year CAGR Returns

Crude Prices Remained Flat During the Quarter

Gold Awoke During the Quarter…
…Gold India and Gold U.S. delivered 8.6% and 9.5% Respectively…
…We Note, However Gold’s 3 Year and 5 Year Returns Remain Anemic

Commodity Prices Remain Flat YTD, with the Exception of Corn

Disasters Galore YTD…
Thankfully, None of These Found Their Way into Our Portfolios

Investment Commentary
Equities
Markets are heading higher, ever more expensive, even as the economy slows down.Budget – More than Meets the Eye
Our first reaction was “Oy Vey”, Yiddish for grief, misery, and disappointment on lack of a stimulus package for consumers. Stepping back, however, there are key elements in the budget that are potential game changers.Overseas Borrowing a Game Changer…
First, the government’s bold approach to tap overseas borrowing. This will lead to a reduction in interest expense for the government, cheaper borrowing costs domestically, and lessen the crowding out effect for corporates, making capital more freely available.
Accommodative Monetary Policy in Concert with Fiscal Policy…
Second, fiscal policy is providing a boost to monetary policy initiatives, with the two working in concert. The lower cost of capital will eventually trickle through to corporates and consumers, and a recovery will ensue. Alongside domestic monetary policy, policy transmission takes on keen importance.
With conservatism on budgeted spending, we expect the RBI to continue to lower interest rates at least twice, and the accommodative stance of global and domestic central bankers remains the primary catalyst for a recovery. Add in the government’s initiatives on infrastructure stimulus, and a path to recovery remains the expected outcome. Finally, the Rs 70,000 crore recapitalization seems to suggest 30,000 crore growth capital. One would expect the public sector spigots to open, but we’ll wait and see.
Earnings Likely Weak, and Short-Term Stress is Likely in Markets and Earnings
Clearly, much more could have been done, and there were misses in the budget. Be that as it may, we continue to expect a recovery to unfold by late this calendar year. Animal spirits could be weak in the short term, and with a weak monsoon, shorter term stresses could arise. A key to arresting the slide will be whether transmission occurs on lower rates meaningfully.
Government Needs to Reconcile Wooing Global Capital with Reviving Consumption Demand
While global capital is keenly welcomed, the primary reason global capital finds India attractive is consumption demand. The argument comes down to investment driven recovery versus consumption driven recovery. While investment driven recovery has multiplier benefits, it is long lived in nature and the benefits are often difficult to identify, nor is it necessarily broad based, starting with capital flowing to companies, then workers, and finally small businesses etc. Much of the revenue accrues in the form of profits to businesses. So even the multiplier benefits are debatable. This essentially translates to a slower consumer economy, and that’s the factor markets are grappling with, with no easy answers.
The Worst of the Credit Cycle Is Behind Us
2018 was a painful year, and a credit crisis drove markets lower. The worst of the cycle is behind us, but the consumer is slowing noticeably. We appear to be close to bottom on NPAs. Worries about systemic risk also appear to be behind us. 2018 was a brutal year for stocks. With rate cuts supporting the market, we think weakness, if any, will be short-lived and should be bought.
Autos and Consumer Sector Recovery Looks to be Delayed Further
A Rs 2/ltr hike will immediately make ownership of two and four wheelers more expensive. Expectations of a boost to consumer spending have not materialized, with the government preferring to focus on infrastructure investments, and this is likely to delay consumer spending recovery.
Portfolio Strategy
Preference Strongly Remains Large Cap for Now
We see nothing in the budget to change our opinion on large size companies. Despite high valuations, our preference remains large cap. We’ll execute a change in strategy when catalysts in the macro economy inform us to do so. We would deploy fresh money to large caps. Within the mid and small cap buckets, small caps offer better value.
Holding during a bull market is difficult because you want to protect your hard-earned gains. And holding during a bear market is even more difficult because you could easily be catching a falling knife. It makes it easier to remember that stocks are the best asset class for earning meaningful long term returns. Stocks are also up on average three of every four years, and some managers deliver even better returns.
Portfolio returns are likely to be widely dispersed. We continue to advise investors to review valuations, align portfolios towards visible earnings growth, and superior skill. One could consider an infrastructure fund; however, we’d like to see the credit spigot open wider. We continue to favour banking, IT, MNCs, services, real estate, infrastructure suppliers (wires, pipes), specialty chemicals and consumption selectively.

Fixed Income
The Plan to Raise Funds Overseas Will Also Require Currency Stability
While the currency has been generally stable, the range has been between 63 and 75 in recent memory. The F.M.s plan to reduce the cost of borrowing is laudable, but there are risks associated with the exercise that may come forward in the next crisis.
The Case for Gilts and Duration Continues…
Three months ago, we made the case for gilts in moderate and aggressive asset allocation profiles (here) The 10 year has fallen 75 bps in that time. With overseas borrowings easing pressure on domestic borrowing, a fiscally conservative budget deficit target of 3.3%, positive liquidity in the system, low inflation, an accommodative Fed, lower crude, slowing demand, and the likelihood of at least one and more likely two more rate cuts, the bias for lower interest rates remains intact. Gilt funds offer the added benefit of a negatively correlated investment stream to equities.
Fiscal Discipline Alongside Overseas Borrowing Will Boost Monetary Policy Mechanisms
While we would have preferred a counter cyclical approach, keeping gross government borrowing unchanged is positive and means that the path for further rate cuts is fairly clean.
Incremental Support for NBFC / HFC Paper
Providing one-time credit enhancement upto 10% for PSU bank purchases of highly rated asset pools of NBFC HFC paper will reduce liquidity pressures facing the sector.
Strategy
Yield compression, absolute yield, and duration are our key preferences in structuring debt portfolios. In the search for yield, distressed debt is another area of opportunity; however, we’d caution investors chasing yield to ensure sound research and due diligence. Net net, the backdrop remains attractive for fixed income investors, with continued caution advised on credit, low quality, low liquidity paper.
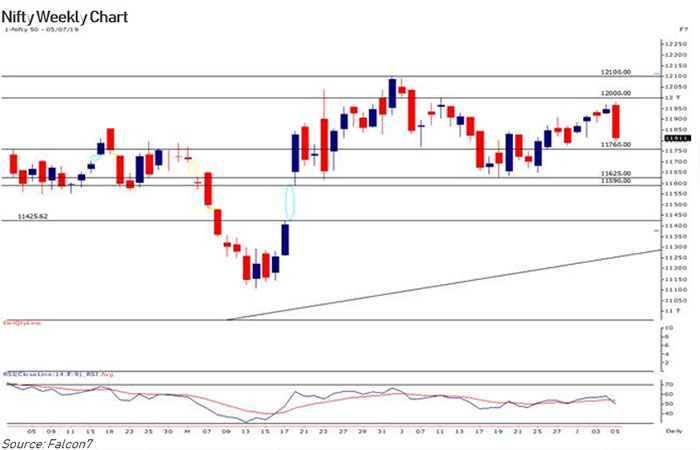
Technical Outlook
The Nifty witnessed steady rise through last week that got erased on the last trading day. Nifty finished the week with marginal gain of 0.2% at 11,811. Broder market indices underperformed benchmark indices with BSE Midcap and BSE Smallcap down 0.56% and 0.68% respectively for the week. On Friday index has formed long body bearish candle engulfing previous four sessions range. Now immediate support for the market is at 11,760 levels. Breaking below 11,760 index is likely to decline towards 11,625-11,590 zone. On the upside 12,000-12,100 resistance zone needs to be taken out with momentum for uptrend to continue. In Nifty weekly options, maximum open interest for Puts is seen at strike price 11,700 followed by 11,800; while for Calls it is seen at 12,000 followed by 12,100. Significant amount of Call writing was seen in immediate strike price suggesting market has overhead resistance at 12,000 levels. India VIX closed the week at 12.66 down by 12.64% for the week. Decline in VIX may help market to find supports at lower levels.

 Download Now
