
Dec 16, 2023
• Global markets have rallied over the last six weeks, led by a decline in US inflation and a dovish Fed.
• Concerns arise from the rising US fiscal deficit and upcoming high levels of speculative-grade non-financial debt maturities.
• Chinese economy is stabilizing; Emerging market economies in Asia are looking strong.
• • We remain close to neutral on equities as resilient local fundamentals offset global headwinds.
• Fixed income market likely to be range bound, opportunity for traders to add alpha.
• Gold in dollar terms close to key technical resistance levels.
The Fed Pivot
Global markets are showing strong momentum as we approach the final few weeks of the year. The last six weeks have proved exceptional for both global equities and bonds. US and European equities have crossed all-time highs, and the US 10-year bond yields have decreased from 5% to less than 4%. The key drivers for this rally include a significant decline in inflation numbers over the last couple of months and a somewhat dovish Fed, which indicated an end of the rate hike cycle and three possible rate cuts in 2024. While this positive momentum might persist in the near term, we don’t think it’s time to celebrate just yet.

Source: Bloomberg, Sanctum Wealth
All data is in local currency and represents price returns.
Global Macro Update
US inflation shows signs of moderation, as evident from the October and November CPI data, although core inflation (excluding food and fuel) remained somewhat sticky at 4% in November. On the other hand, the robust November jobs report indicated a strong economy. The Fed expects the growth to slow down gradually and the inflation to remain in check. The recent pivot in Fed policy reflects this sentiment, with the central bank signalling an end of the rate hike cycle and a potential 75bps rate cut in 2024, a significant shift from the September 2023 policy meeting. The markets are now pricing in 150bps rate cuts next year as market expectations remain far more dovish than the Fed’s. However, it is essential to note that the Fed will continue with quantitative tightening by contracting its balance sheet, keeping liquidity tight.
In the fiscal year ending September 30, 2023, the US fiscal deficit surged by 23% YoY to USD 1.7tn, the highest outside the Covid era. The deficit would have been even higher by an additional USD 321bn if the US Supreme Court hadn’t declared the government’s student loan forgiveness program unconstitutional. Additionally, global defence spending is increasing due to ongoing conflicts in Europe and the Middle East. The expanding fiscal deficit, coupled with the Fed reducing its bond holdings, is likely to impact bond yields and counter the rate cut expectations.
US Fiscal Deficit has grown significantly

Source: Bloomberg, Sanctum Wealth
Fiscal year in US is from 1st October to 30th September
Another key development to monitor is the “wall of maturities”. Standard & Poor’s highlights that nearly USD 247.7bn worth of speculative-grade non-financial debt is set to mature in 2024, more than double the amount in 2023. Maturities will rise further to USD 389bn in 2025. This debt will have to be refinanced at much higher rates, even after factoring in potential rate cuts by the Fed, resulting in a likely increase of default rates among speculative-grade corporates. According to S&P Global Ratings, the default rate is projected to reach 4.25% by March 2024, twice the figure recorded in March 2023.
High levels of speculative-grade debt maturing in the next few years

Source: S&P Global Ratings Credit Research & Insights
Includes bonds, loans and revolving credit facilities that are rated by S&P Global Ratings.
Excludes debt instruments that do not have a global scale rating.
The Chinese economy appears to be stabilising, thanks to policy measures including sovereign fund stock purchases and fiscal stimulus aimed at boosting infrastructure and housing demand. However, the real estate crisis deeply impacted Chinese consumers. Excessive debt in the real estate industry and bankruptcies are adding to woes. Hence, a substantial economic recovery will require additional time, but the economy is headed in the right direction. Further, Chinese equity valuations are very attractive which could support the Chinese markets even as the economy takes time to recover.
Other parts of the emerging markets, especially Asian economies such as Indonesia, and Vietnam are exhibiting resilience. The diversification of the supply chain has benefited these economies. Moderation in inflation in these economies as well as expectations of limited US dollar strength with the peak of monetary tightening by the Fed now in the past is also reducing macroeconomic headwinds for emerging markets.
India Market Update
Indian equity markets mirrored global sentiments and rallied in November. State election results that favoured the political party of the incumbent union government, BJP, have propelled equity markets to new highs. Broader markets outperformed Nifty with mid-caps and small-caps delivering double-digit returns. Public sector enterprise (PSE) again led the rally last month. PSEs have emerged as top performers this year. Auto and Healthcare also contributed to the rally.
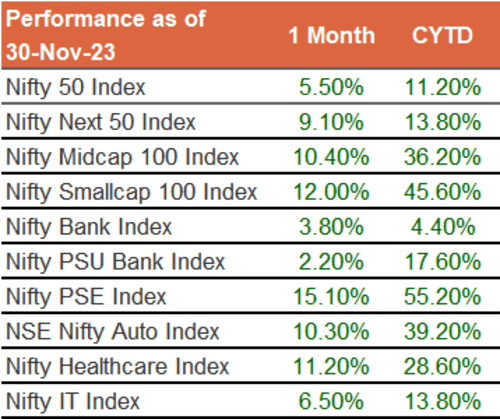
Source: Bloomberg, Sanctum Wealth
The above returns are price returns
Tactical Asset Allocation | Quarterly Asset Pairs Review
Every quarter, the Sanctum Investment Committee convenes to discuss the findings of our asset pair model, which then serves as a guide for our tactical asset allocation decision and our model portfolios. This quarter, the asset pair model scores have shifted slightly more in favour of equities, continue to favour large-caps over mid-caps, favour gold, and remain neutral for other asset pairs.
Equities vs Bonds
Macro, earnings are supportive, but global headwinds a concern
Despite indications of a moderation in global growth, data from India continues to reflect positivity. Low-frequency indicators, such as GDP growth, and high-frequency metrics including PMI, GST collection, non-food credit growth, capital goods industry growth, and auto sales, among others, continue to demonstrate strength. Additionally, with crude oil prices now under control, a built-up of FX reserves, under control current account deficit, and a relatively stable INR, India’s external macro factors appear positive. Although Indian economic growth has shown resilience, it’s important to note that in the event of a global growth shock, India is unlikely to be immune and could see its growth getting impacted.
GDP growth in line with expectations
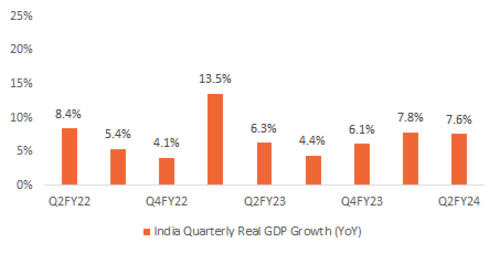
Source: Bloomberg, Sanctum Wealth
PMI data also remains strong

Source: Bloomberg, Sanctum Wealth
Corporate earnings for Q2 FY24 (quarter ending September 2023) exceeded estimates across the board, primarily driven by lower commodity prices that boosted margins. Profits of Nifty 50 companies grew by 28% YoY in the last quarter, surpassing the estimated 21% growth. Key contributors to this outperformance were sectors such as automobiles, financial services, and cement. However, a point of concern arises from the muted revenue growth. With limited prospects for additional gains from margin expansion, continued earnings momentum hinges on revenue growth picking up in the future.
Broad-based beat in earnings in Q2

Source: Bloomberg, Sanctum Wealth
Bond yields attractive vs. forward earnings yield
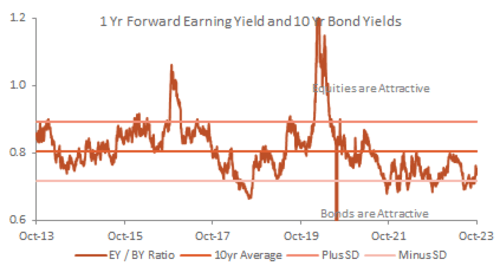
Source: Bloomberg, Sanctum Wealth
The recent rally has pushed indices to cross key resistance levels. Furthermore, despite recent FII selling, domestic institutional investors have supported equities with fresh inflows. The possible end to the US fed rate hike cycle and the expectation of a prolonged hold by the RBI also support Indian equities.
Finally, looking at valuations, Indian equities are trading close to historic averages in terms of trailing and forward P/E, but appear expensive based on P/S and market cap to GDP ratio.
Considering concerns about global macroeconomic conditions, despite robust local equity fundamentals, we advocate a cautious approach. Therefore, we recommend investors deploy fresh capital into equities gradually. If there were greater comfort with valuations, a more aggressive deployment into equities could have been considered.
Large-caps vs Mid-caps
Midcaps more expensive
So far this year, mid and small-caps have significantly outperformed large-caps. However, with the rally in mid and small-caps, the valuation advantage they once possessed over large caps is no longer present. Additionally, according to Bloomberg’s consensus estimate, even the two-year forward earnings growth CAGR for mid-caps is similar to that of large-caps. Technical indicators also do not favour either of the segments. Therefore, we believe it is prudent to maintain overweight in large caps in this environment. We had significantly reduced our midcap allocations following the last asset pair review and continue to retain that allocation even now.
Midcaps relatively more expensive than large caps

Source: Bloomberg, Sanctum Wealth

Source: Bloomberg, Sanctum Wealth
Fixed Income | Corporate vs Government | Short-term vs Long-term
Yields have peaked, credit environment favourable
Not much has changed in the fixed income market in recent months and this is also evident in the largely unchanged scores for asset pairs. Despite a minor widening of credit spreads, they remain below historical averages, suggesting limited upside in adding high-quality bonds over government bonds. On the other hand, the credit environment as reflected in the upgrade to downgrade ratio, credit demand, and low corporate leverage, remains supportive.
Corporate spreads remain low

Source: Bloomberg, Sanctum Wealth
Upgrade to downgrade ratio has moderated

Source: Bloomberg, Sanctum Wealth
The yield curve too remains flat and inverted in some parts. Negative systematic liquidity has put pressure on short-term yields, despite expectations of a prolonged pause by the RBI.
In contrast to the highly volatile US bond yields, Indian bond yields, as represented by India’s 10-year government bond yield, have been range bound in a somewhat narrower range of 7-7.5%. This presents an opportunity for traders to generate alpha. Hence, investors with shorter time horizons could look at some actively managed debt funds.
Indian bond yields have been range-bound

Source: Bloomberg, Sanctum Wealth
Yield curve is still flat

Source: Bloomberg, Sanctum Wealth
The rate hike cycle in India and globally is now most likely behind us. Hence, for longer-term investors, some allocation to duration may make sense. We continue to be selective in the private credit space, considering the sheer number of funds raising or looking to raise and deploy money over the next few quarters.
Gold vs Cash
Gold close to key technical resistance
After trading in a broad range of USD 1,800 – 2,080 for the past several months, Gold touched all-time highs and breached its crucial resistance zone of USD 2,100/oz but failed to sustain above it. From a technical perspective, a sustained close above USD 2,100 could potentially generate positive momentum for Gold. On a fundamental level, geopolitical tensions in Europe and the Middle East provide a compelling argument in favour of Gold. Although global inflation has eased, it remains relatively high in absolute terms. The likelihood of significant dollar strength is low, which bodes well for gold, given the historical negative correlation between the dollar and gold. Moreover, the case for allocating funds to gold as a hedge against future macroeconomic uncertainties remains strong.
Moderation in US Dollar positive Gold

Source: Bloomberg, Sanctum Wealth
USD Gold close to all-time highs

Source: Bloomberg, Sanctum Wealth
INR vs USD
India’s fundamentals to support INR
Even though the INR has depreciated over the last year or so, unlike the taper tantrum of 2013, India’s external macro factors look stable. The RBI has used every opportunity to shore up FX reserves, which are currently at very comfortable levels. With crude oil prices looking manageable, our current account deficit and balance of payments are also strong. With expectations that the bulk of dollar strength may be behind us, we think the INR may remain stable going forward.
RBI has been able to rebuild FX reserves

Source: Bloomberg, Sanctum Wealth
Balance of payments has turned positive

Source: Bloomberg, Sanctum Wealth
Sanctum Multi-Asset Portfolios
A representation of our tactical asset allocation calls is our multi-asset portfolios called SMAPs. We manage three profiles- Shield (conservative), Enhancement (balanced), and Generation (aggressive)
Last quarter in follow-up to our asset pair review we had drastically cut exposure to mid and small-caps in our SMAPS portfolio, we are now comfortably large-cap oriented within our equity allocation. We are not looking to make material changes to those weights given the continuation of our views on equities.
We had also decided to exit Powergrid INVIT in SMAPs as its acquisition pipeline appeared unclear, this has played out as expected with Powergrid INVIT prices correcting more than 15% since we exited as the acquisition pipeline still remains unclear. The market was also eagerly awaiting clarity on the denotification of SEZ spaces in commercial offices. With the government allowing floor-wise denotification of SEZs, REITs could benefit from a rise in occupancies of commercial offices. This is likely to be visible over the next few quarters. We have some exposure to REITs and continue to hold the same in SMAPs.
The portfolios have performed broadly in line with expectations. Here is a performance update of our three multi-asset portfolio strategies:

Performance is calculated using Time Weighted Returns, net of fees and expenses. Returns over one year are compounded annually; returns for less than one year are absolute. Please note that SEBI does not verify the performance information provided above. Please note that past performance is not a guarantee of future performance.
NSE Multi Asset Index 2 composition is 50% Nifty 500, 20% Nifty 50 Arbitrage, 20% Nifty Medium Duration Debt Index, 10% Nifty REITs and InVITs
