
Mar 15, 2021
• The Fed meets this week. Will they twist QE to suppress long term US yields?
• They have much to think about inflation, but no change in stance expected.
• Market inflation forecasts on the rise.
• Will the Fed recognise that the passing of Biden’s plans questions how long they can keep rates at close to zero?
• Europe not seeing the same inflation dynamics.
• Stay short duration.
Fed meeting next week: expect a signal that inflation is not their primary concern. Despite a quieter week in bond markets and a rebound in equity markets, the inflation story is not going away. There will be much market focus on the statement from the Fed’s meeting. Will they signal any intent to suppress long term interest rates the so-called operation twist? And will they have any view on whether there is a risk of inflation hitting their long term average a little quicker than they previously thought? After all, President Biden has delivered a $1.9trillion budget… surely it makes a difference?
We suspect that for the moment, the Fed would prefer to stand pat and do nothing. However, some on the committee may be getting somewhat uncomfortable with the backing up of long-term interest rates. A twist to their buying of treasuries would shift buying to the longer end of the curve to suppress long term interest rates.
The Fed doing nothing, as we expect, risks the 10-year yield rising still further. We continue to advise that a 10-year bond yield through 2% is quite possible in the coming months. Investors would be wise to keep bond portfolio duration short. Emerging market debt has rebounded and should be OK if the dollar on trade weighted basis does not rise sharply. The NASDAQ index will remain under pressure as a long duration play. However, we suspect that the corporate results season in April could help put a floor under further absolute losses.
The incoming US data supports a view that inflation will rise meaningfully above 3% by the end of Q2/early Q3. Indeed, we note that several economists have increased their US inflation forecasts by a couple of tenths in recent weeks. We know that the oil price returning to above $60 per barrel from extreme lows a year ago will drive much of the pick-up in inflation.
There are risks that the rise in US inflation could be a little worse than the economists expect, and it might hang around at an elevated level for a little longer than some had expected. 23 out of 33 components of the inflation index are already running at an annualised inflation rate of more than 2%. Only three items are currently in negative territory.
The housing component on inflation is no longer a drag: A key element in the inflation basket is the cost of housing, labelled shelter. This category catches rent, mortgage payments and the cost of new houses, among others. It typically used to run at an inflation rate of 3% per annum before COVID. It is running slower than that at present. We estimate that a return to normal levels will add around 0.3% to the aggregate inflation in a structural way. That is, it will not be a transient effect.
Shortages of inventory of some goods could reinforce any spike in price inflation. As the effect of the pandemic eases, it has become clear that the consumer is making a comeback, particularly in the US. There is a growing risk that wholesalers may have insufficient stock to meet demand. The Wholesale inventory to sales ratios has fallen to low levels. They are not alarmingly low. However, the increase in consumer sales, if sustained, could precipitate upward pressure on prices. The ratio rose by 4.9 percentage points month-on-month in January, a very strong reading, only surpassed by the post-COVID jump in June/July. The risk to inflation in this development is that it may be an early warning that supply chains are constrained due to the ravages of COVID, especially for those wholesalers that are reliant on longer chains with international links.
Remember that inflation does not have to look and feel like it is getting out of control for the Fed to react. Even just signs that inflation is trending back to a more normal level could precipitate the Fed to move its policy on a path to the 2.5% it would consider as normal.
The first place we might see an adjustment of policy would be in the dot plot. The Fed has never been truly comfortable with this communication mode, believing that economists over-interpret the chart. We think we can probably believe that for the moment, members of the FOMC committee will leave their dots exactly where they were at the last meeting for fear of adding still further volatility to the markets.<
Indefinite accommodation: how long will the Fed dot plots stay down? The Fed publishes its famous dot plot at the end of every meeting, showing where the members think Fed policy rates will be at certain intervals in the future. It has a curious look about it at the moment. None of the Fed board members is plotting a rise in the Fed policy rate until December 2022. Then some are willing to see the first rate rise no earlier than December 2023. Beyond that, the Fed consensus is that the Fed’s policy rate increases to 2.5% or above. One interpretation is that the Fed agrees that the current rate of rates is too low and that the normal rate is around 2.5%. It just all a matter of timing. The risk for markets, and duration assets, is that the guess on the timing of increases timing is too far out and that it could happen a lot sooner.
This time, Europe is different: The policy response from the ECB is creating a divergence between US bonds yields and German bunds. At its most recent meeting, the ECB made it quite explicit (for a Central Bank) that it will continue to use its PEPP program to keep long-dated yields low. It is to be expected that the current monthly rate of purchases of eligible bonds will rise from the recent average of EUR 55 billion to EUR 70 billion or even more until June or July. At this point, another assessment will be in order.
Chart 1: The spread between US and German 10Y bond yields (bps)
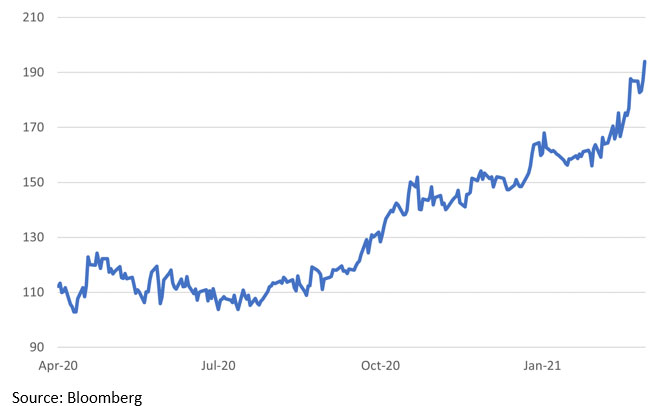
The bond market has taken note. The steady rise in the yield gap between Treasuries and Bunds is set to continue for as long as the ECB is more actively taking steps to keep the long end low. The ECB has also taken a clear line that it views the current surge in the inflation numbers as transitory, driven, among other things, by technical factors in the measurement methodology and other oddities like a sudden spike in the cost of German vacation packages as a result of COVID.
The gap will widen: We thus expect the decoupling of German bunds and Treasuries to continue and even accelerate, to well beyond the 200 bps level (see chart 1 above). The bond market seems unable to shake its angst about inflation and the Fed’s easy stance about it. The 1.6% yield level on the 10-year government bond is under continuous siege. A break above this level, especially if it happens before the meeting next week, will be a litmus test for the Fed and the market.
